


Bitcoin is presenting an interesting conflict across the higher and lower timeframes.
The weekly trend remains bullish, but the daily and 4H charts are showing signs of increasing selling pressure. This is where traders must learn to adapt instead of becoming emotionally attached to one direction.
Let's break it down. 👇
🔵 1. WEEKLY: BULLISH TREND, BUT WATCH THE REJECTION
The weekly structure remains bullish. However, price is forming a potentially significant rejection candlestick.
If the candle closes with a clear rejection wick, it could signal that sellers are defending higher prices.
Important: The weekly candle has not closed yet, so the rejection is not confirmed. The closing price will matter.
🔴 2. DAILY: SELLERS APPLY PRESSURE
Bitcoin has broken below $81,142.22, suggesting that sellers are gaining control of the short-term structure.
The recent candlestick behaviour also appears to favour sellers.
If Bitcoin remains below this level, it could act as resistance during a recovery. A reclaim and sustained move above it would weaken the bearish interpretation.
⚠️ 3. THE 4H CHART: THE MOST INTERESTING DEVELOPMENT
This is where the setup becomes particularly interesting.
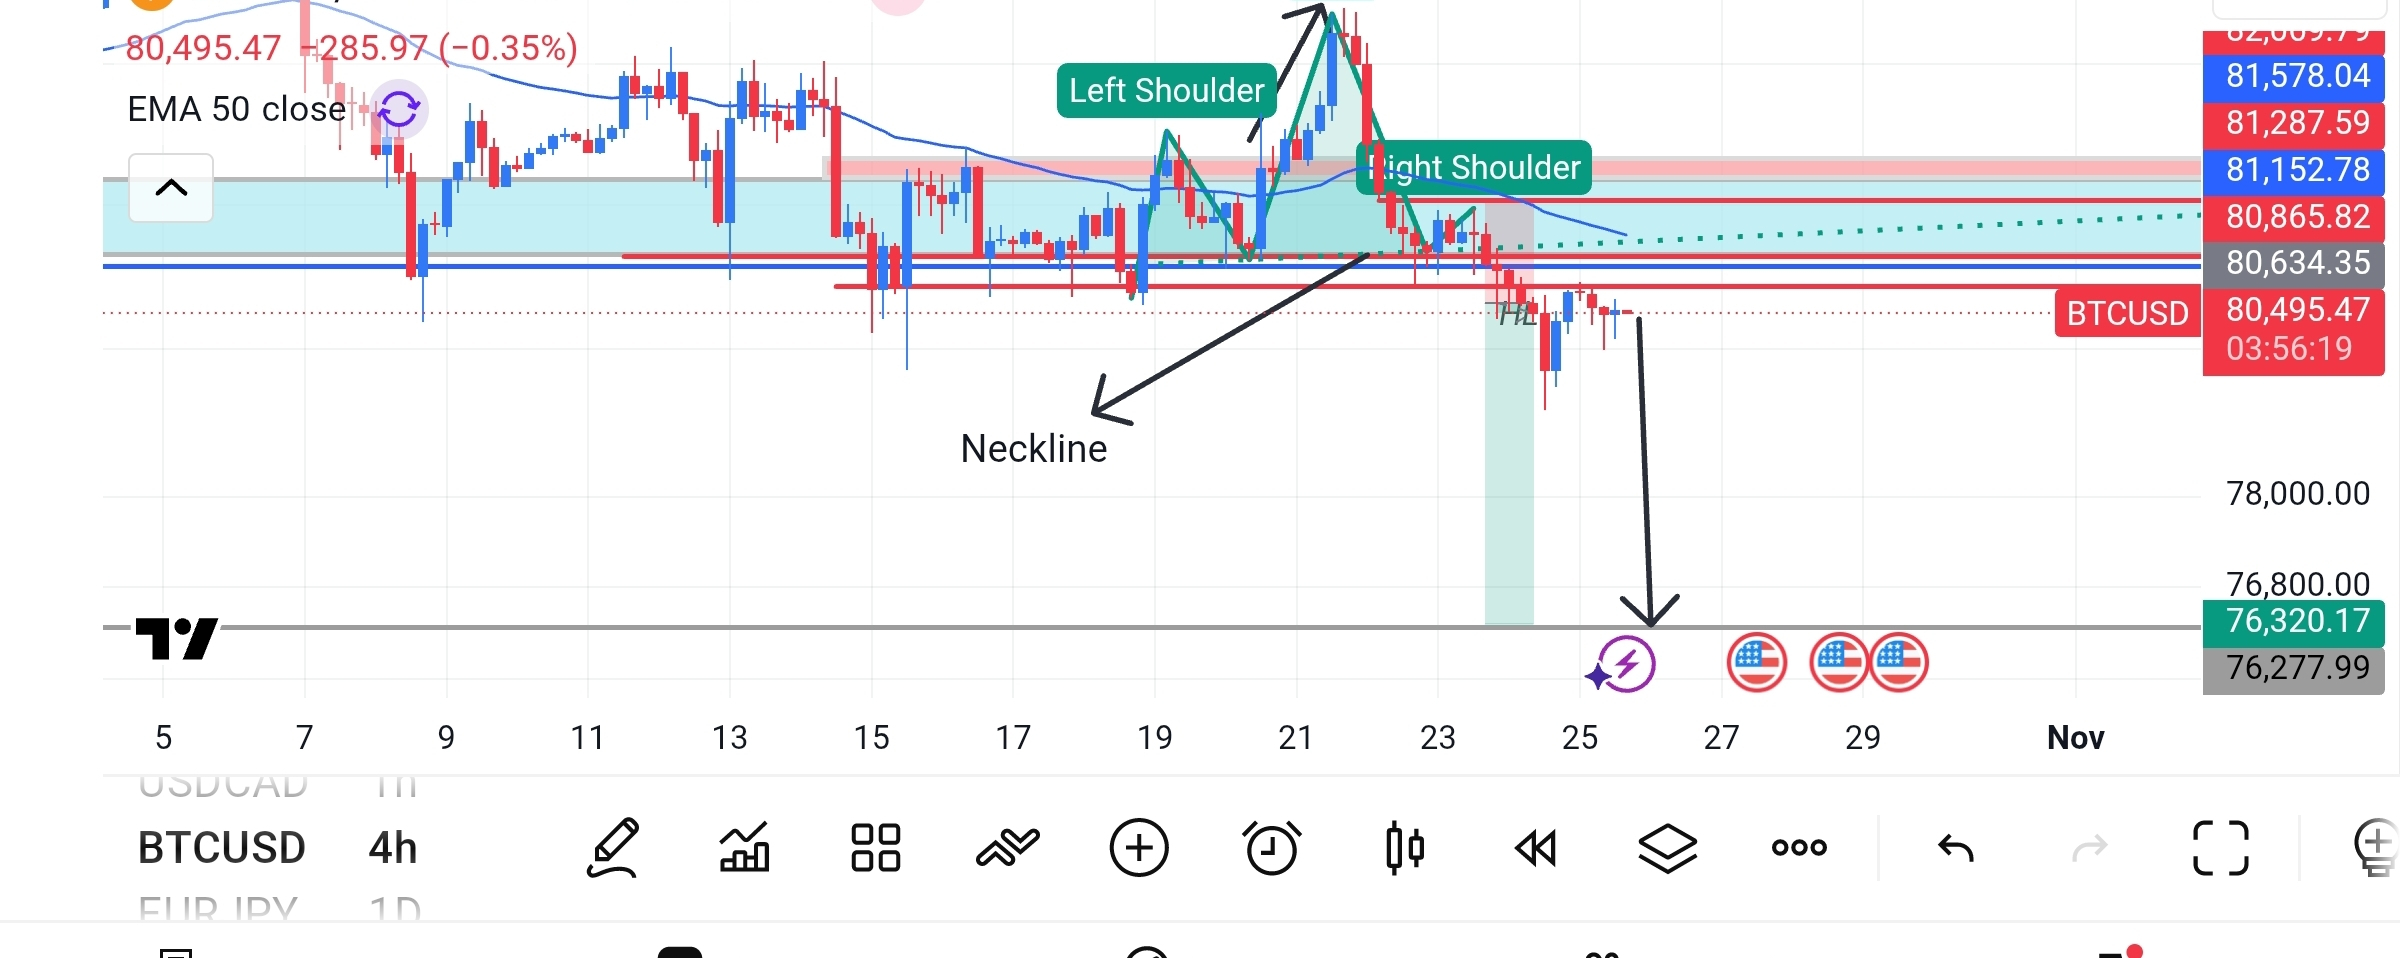
Bitcoin has formed a structure resembling a Head and Shoulders pattern.
The pattern consists of:
A left shoulder.
A higher head.
A lower right shoulder.
A neckline around the $80,600–$80,700 region on your chart.
Price has broken below the neckline, supporting the possibility of further downside.
This is a good example of why traders must adapt.
The higher timeframe can remain bullish while the lower timeframe develops a bearish correction. We don't have to predict every move perfectly; we need to recognise when market structure changes.
🎯 4. MY BEARISH SCENARIO
Potential entry: $80,666.34
Stop loss: $82,055.28
Target: $76,355.76
The bearish idea is based on the neckline breakdown, daily selling pressure and the potential Head and Shoulders formation.
For this scenario to remain valid, I would want to see price continue to respect the broken neckline as resistance.
A recovery above the neckline, particularly if followed by a sustained move above the right-shoulder region, could weaken the setup.
The target is a potential destination, not a guaranteed outcome. Price may encounter support before reaching it.
🧠 5. THE LESSON: ADAPT TO THE MARKET
One of the biggest mistakes traders make is becoming attached to a bullish or bearish opinion.
The weekly chart can be bullish while the 4H chart turns bearish. Both observations can be true because they describe different timeframes.
A good trader doesn't need to be right about the direction all the time. A good trader needs to respond when the evidence changes.
💬 WHAT'S YOUR VIEW?
Will Bitcoin continue its bearish move toward $76,355, or could buyers reclaim the broken neckline and invalidate the setup? $BTC
Share your analysis below. 👇
#Bitcoin #BTC #CryptoAnalysis #TradingPsychology