🚨 $BTC
, $ETH
OR — WHICH COIN LOOKS STRONGER RIGHT NOW?
Most traders watch price. Smart traders also watch money flow. 👀
📊 Here’s what the Binance data reveals:
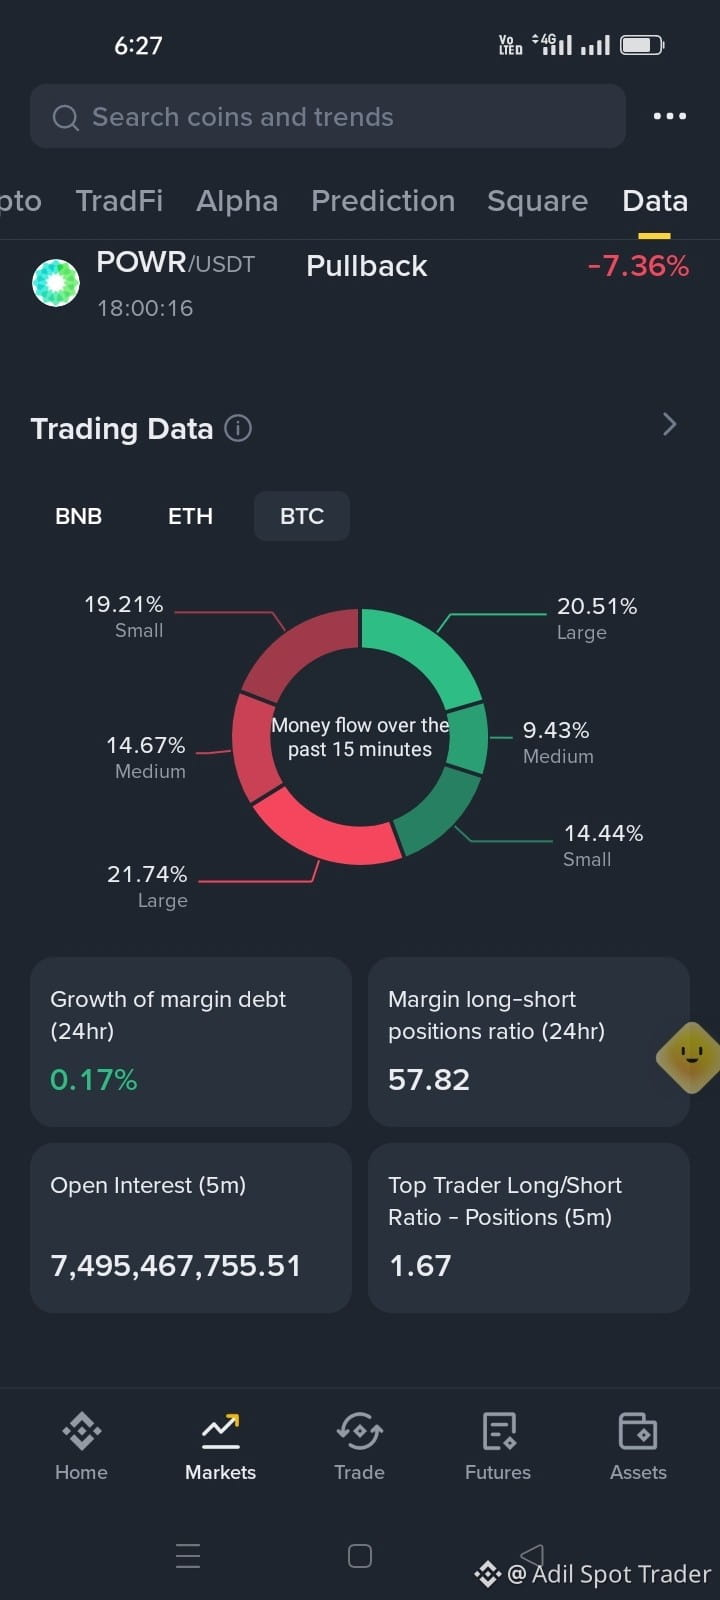
🔴 BTC: 55.62% sell-side flow vs. 44.38% buy-side flow. The $80K–$82K zone is critical.
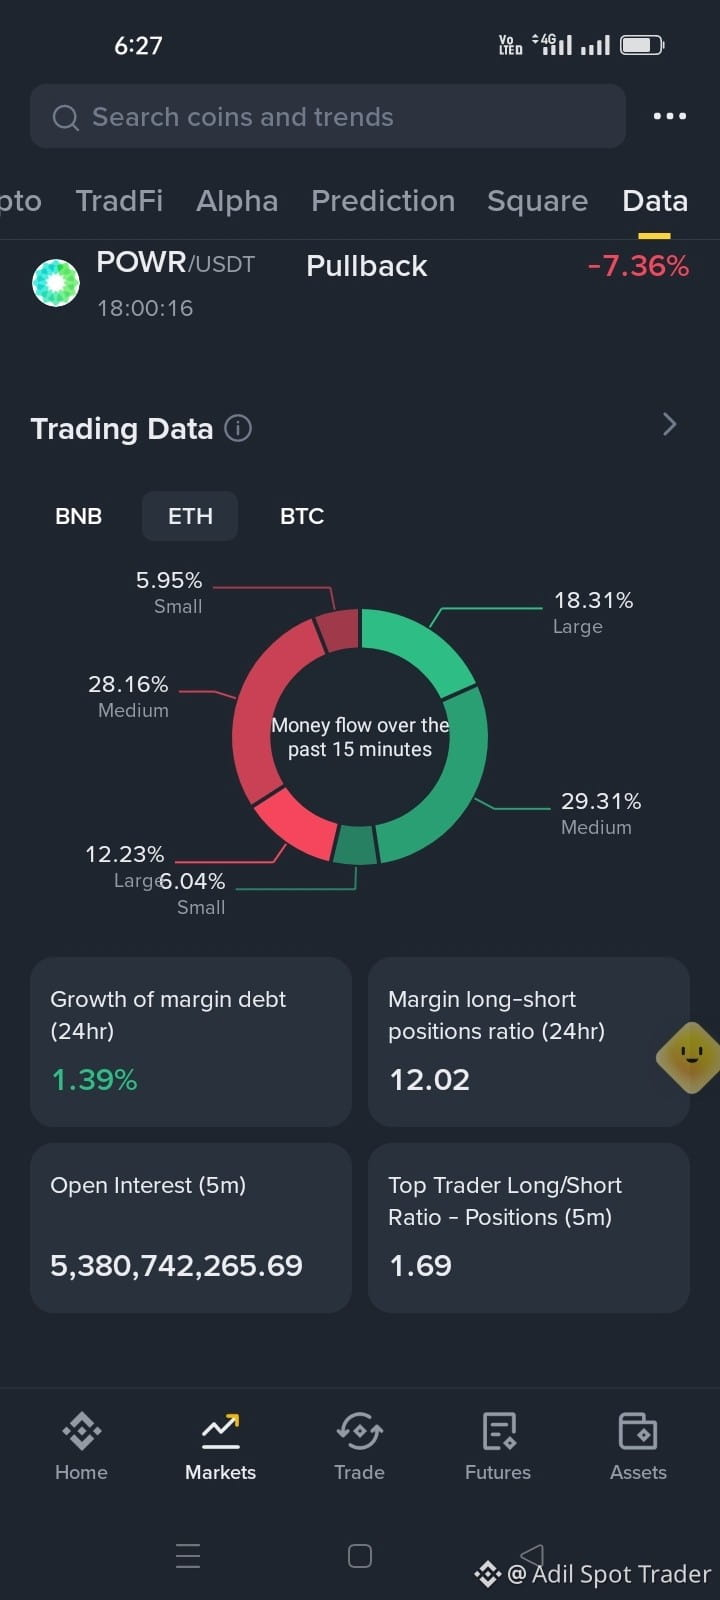
🟢 ETH: 53.66% buy-side flow vs. 46.34% sell-side flow. Showing relative strength in this snapshot.
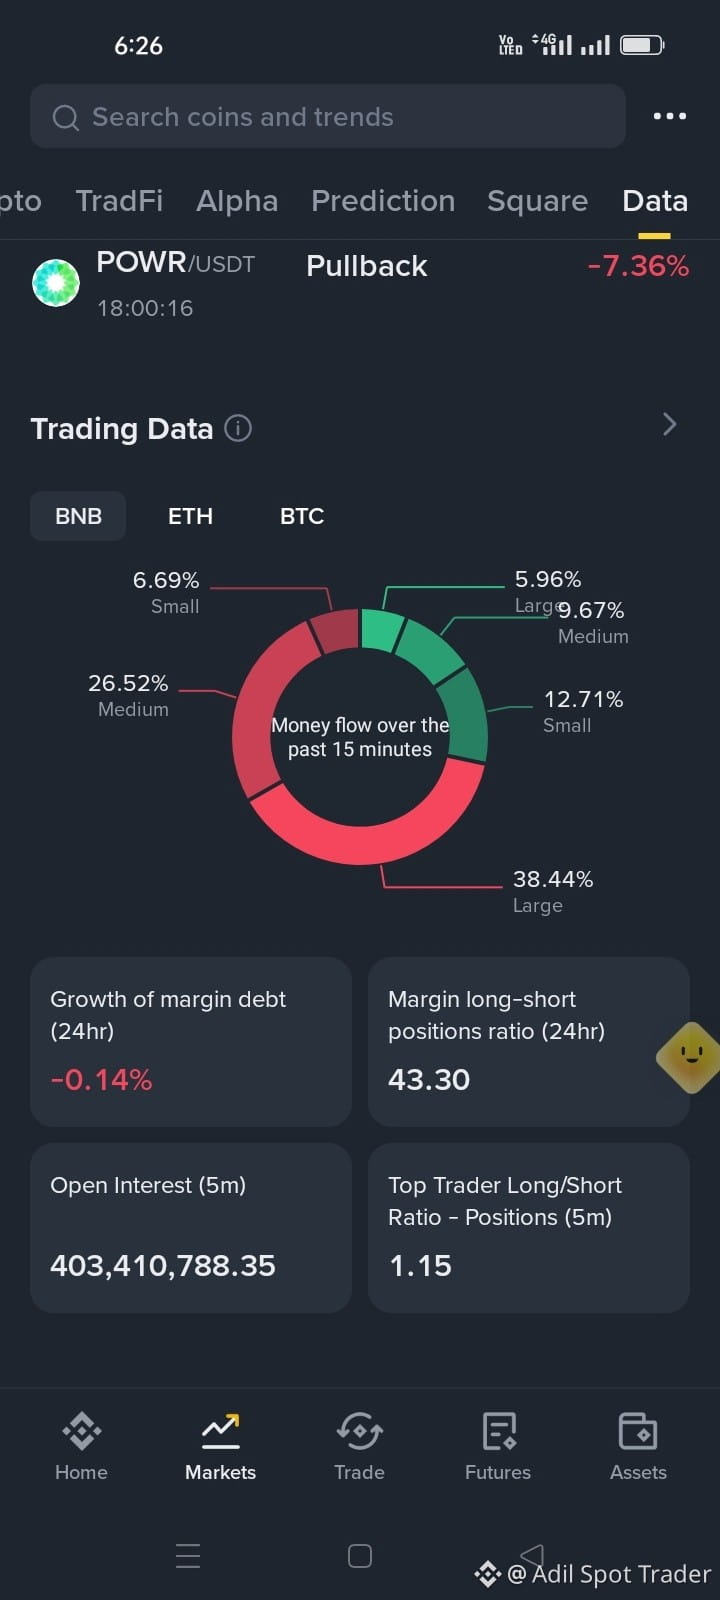
⚠️ BNB: 71.65% sell-side flow vs. 28.34% buy-side flow. Selling pressure deserves attention.
🎯 Key levels to watch:
• BTC: $80K–$82K support zone
• ETH: $2,340 support | $2,380–$2,390 resistance
• BNB: $735 support | $752–$760 resistance
🔥 My takeaway: ETH has the strongest relative money-flow reading in these screenshots, while BNB shows the heaviest selling pressure.
But remember: 15-minute money flow is NOT a guaranteed price prediction. Wait for price action, volume and breakout confirmation before making a decision.
👇 YOUR TURN: Which coin would you watch for the next potential move?
🟠 BTC | 🔵 ETH | 🟡 BNB
Drop your choice and explain WHY! 👇
#bitcoin #Ethereum✅ #bnb #CryptoAnalysis #BinanceSquareTalks