🚀 JCT (Junction) Surges 159% — Is Another Breakout Coming?
JCT is making waves in the crypto market! 🔥
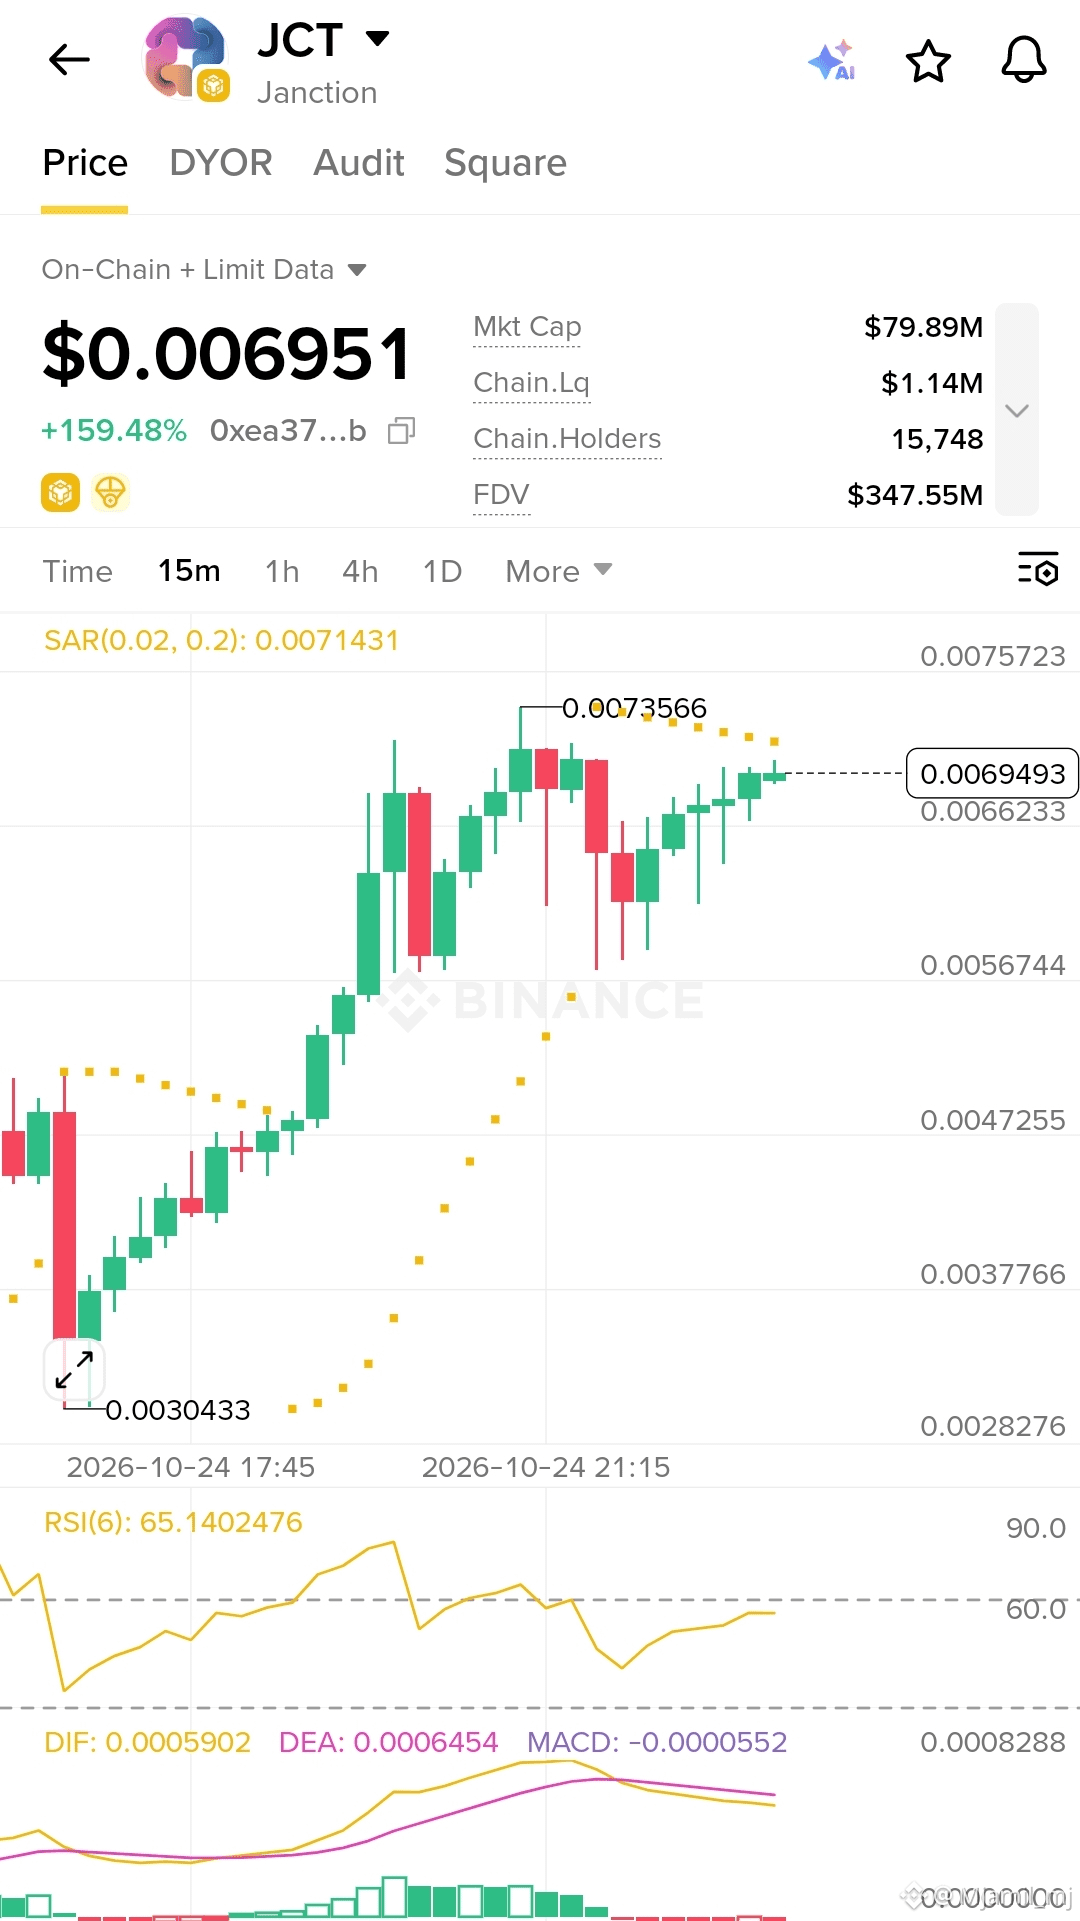
According to the Binance chart screenshot, JCT (Junction) is trading around $0.006951, showing an impressive +159.48% gain. Its market capitalization stands at approximately $79.89 million, with a reported circulating liquidity of $1.14 million and 15,748 holders shown in the screenshot.
📊 Technical Analysis (15-Minute Chart)
- Price Action: JCT has experienced a strong upward move and is now consolidating near $0.00695.
- Resistance Zone: $0.00735–$0.00757. A breakout above this area could signal further upside, if supported by strong volume.
- Support Zone: $0.00662, followed by $0.00567. A breakdown below these levels could increase selling pressure.
- RSI (6): 65.14 — bullish momentum remains relatively strong, but the indicator is approaching overbought territory.
- MACD: DIF is below DEA, and the histogram is slightly negative, suggesting that short-term momentum may be cooling.
- SAR: The dots are above the latest candles, indicating potential short-term bearish pressure.
🔎 What Comes Next?
JCT could attempt another upward move if buyers push the price above resistance with strong trading volume. However, continued consolidation or a pullback is also possible if momentum weakens.
⚠️ Risk Reminder: A gain of nearly 160% can attract profit-taking and sharp price swings. Always do your own research (DYOR), check liquidity, and manage risk before making a trading decision.
🔥 Can JCT break above $0.00735 and continue its rally, or will sellers take control?
Share your analysis in the comments!
#JCT #Junction #Crypto #Binance #Altcoins #TechnicalAnalysis #CryptoTrading #DYOR $JCT $AAPLB $BTC