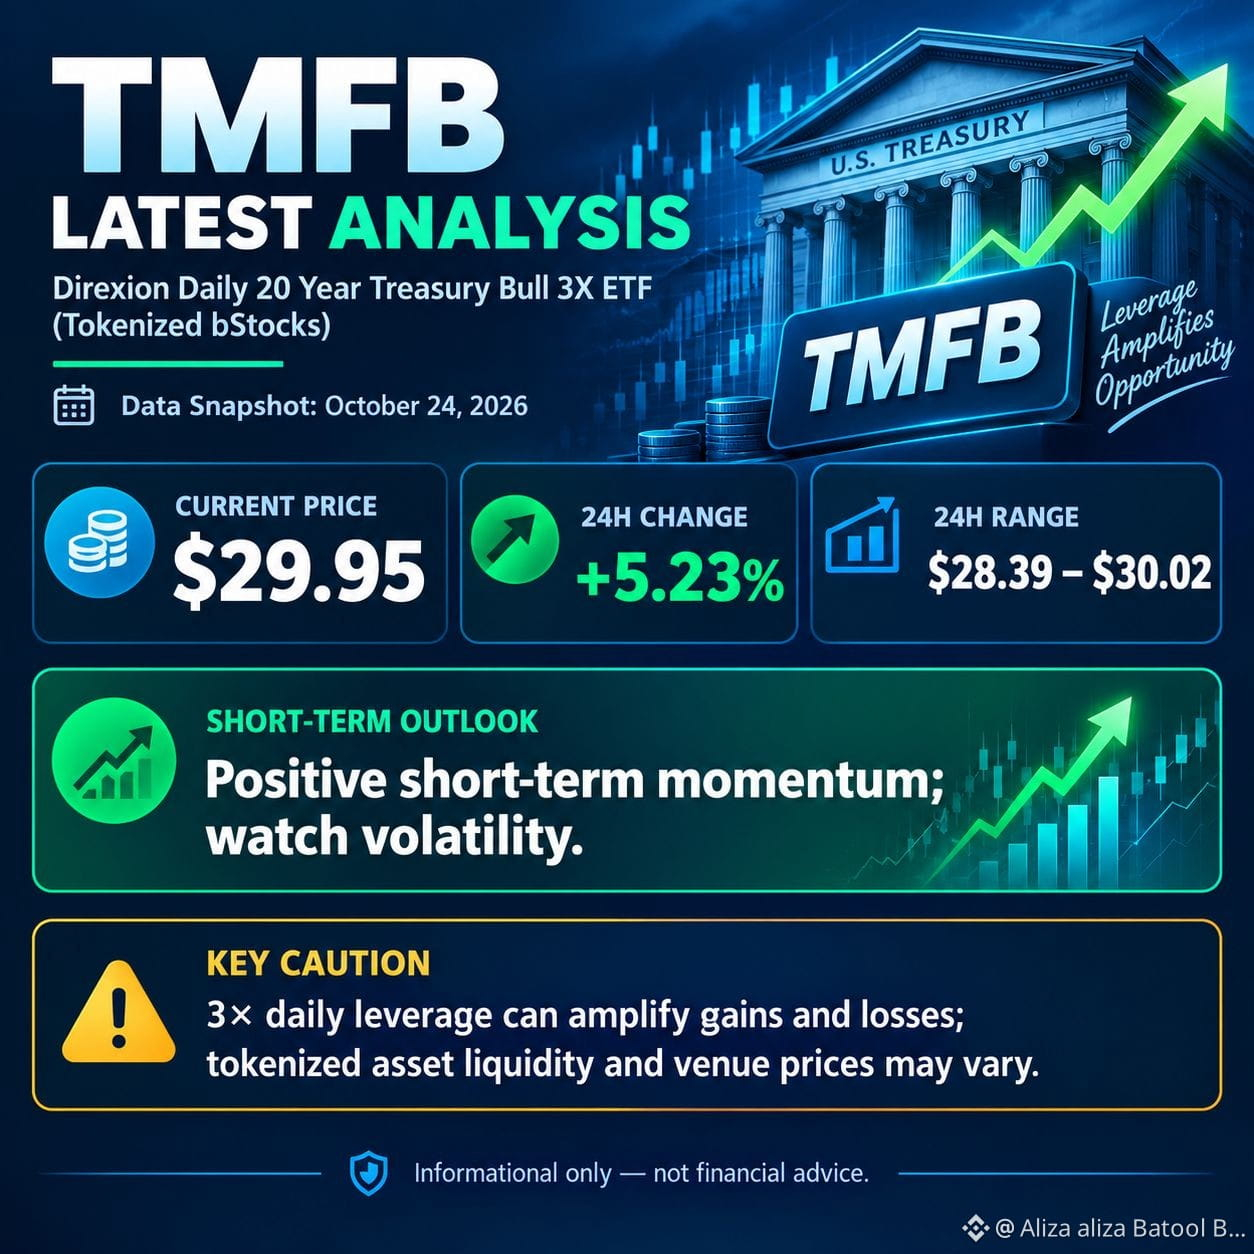
$TMFB Latest Analysis 📊
October 24, 2026 · Latest available market data
$29.99
+5.66%
24-hour change
24-hour range
$27.96–$29.99
Market snapshot; venue prices can differ.
Technical analysis
Trend: Short-term momentum is bullish after a strong recent rise.
Resistance: $30.00. A sustained break above this level could support further upside.
Support: Around $29.00, with $27.96 as a lower reference level.
Bearish signal: A move below support could trigger a pullback.
Verdict: Cautiously bullish, but TMFB is a high-risk product. It targets 3× daily performance of a long-term Treasury ETF, so Treasury yields, leverage, and daily compounding can cause sharp losses. #BinancePick #EarningsSeason #DowDrops653Points #MarketsPriceJust10%ChanceOfFedHikeNextWeek #OCCRemovesStablecoinSevenDayRedemptionExtension