$BTC
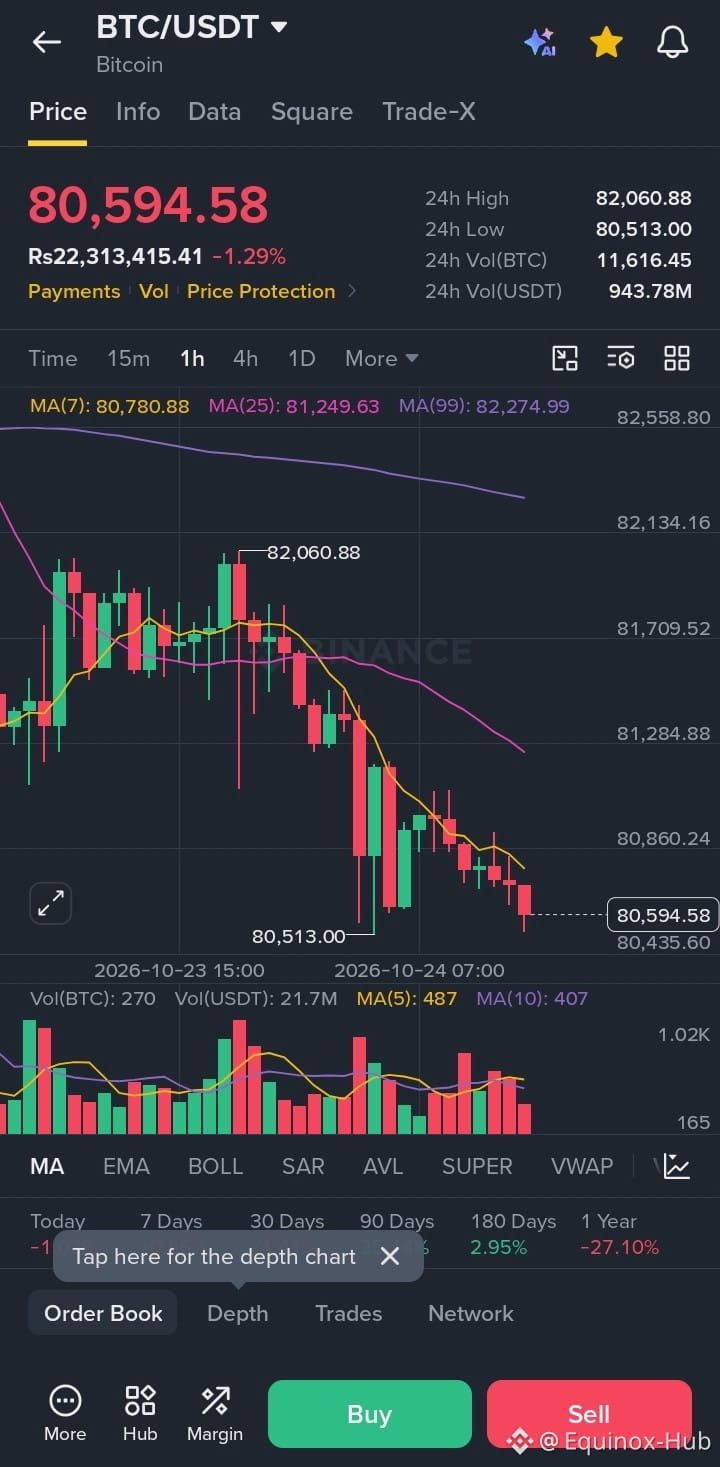
Price rejected the highs and is trading cleanly below both EMAs. The short is not at current price — it’s the retest of the exact resistance cluster your chart marked.
🟡K-Line (1H)
Current price: $80,653.97
EMA 20: $81,058.71
EMA 50: $81,528.35 → EMA20 below EMA50 (bearish alignment)
RSI (14): 37 (Neutral)
MACD: −19.7 (Bearish momentum)
Volume: 0.5× average (below average)
Overall Trend: Bearish
🟡Short Trade Plan (Confirmed Setup – Exact Levels)
Entry Zone
$81,118.97 – $81,608.63
(Reference: $81,363.80)
Stop Loss
$81,935.06
Risk: $571.260
🟡Invalidation
Close above $81,608.63 cancels the trade
🟡Take Profits
TP1: $80,506.91 (1.5R)
TP2: $79,935.65 (2.5R)
TP3: $79,364.39 (3.5R)
Risk / Reward
1 : 2.5
Entry Conditions (from your chart)
✅ Price below EMA20 ($81,058.71)
✅ EMA20 below EMA50 (downtrend alignment)
✅ MACD histogram below zero
✅ RSI below 50 and above 28
❌ Volume at or above the 20-bar average
Core signals agreeing (Trend + MACD + RSI): 3/3
🟠Reason .
Short entry is the retest of resistance at $81,608.63, a level built from 5 pivot highs. The stop sits just above it, so a break of the level ends the idea. Momentum: trend bearish, MACD histogram −19.71, RSI 37, volume 1.0× the 20-bar average. Targets are the structural supports below entry, extended with measured moves.
Waiting for price to come back into the $81,118.97 – $81,608.63 zone.#BitcoinHashrateHitsSevenMonthHigh