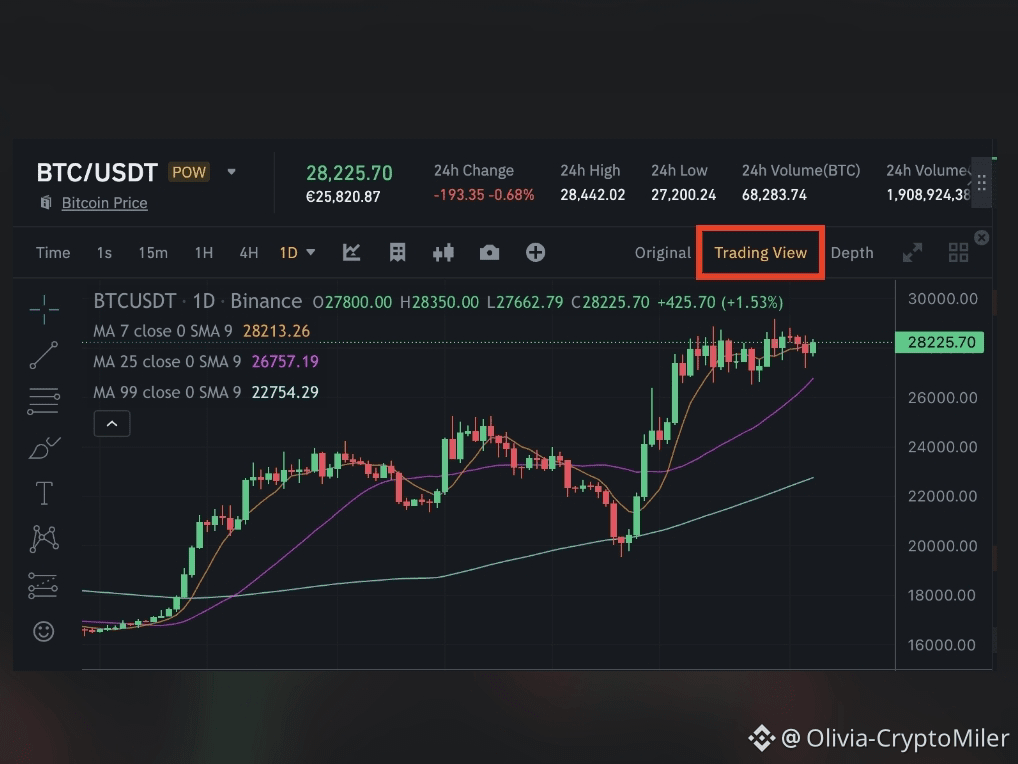
Bitcoin ($BTC
/USDT) — Trend & Support Analysis
Trend Overview: The daily price chart shows Bitcoin consolidating above key moving averages. Price action reflects a healthy rebound after retesting lower support zones.
Moving Averages (MA): The short-term moving average (blue line) is curving upward above the long-term baseline, indicating growing bullish momentum.
Key Support & Resistance: Strong support is established around the lower red horizontal line zone. Resistance lies near the previous local peak, where sellers previously stepped in.
Volume Insight: Trading volume bars at the bottom show elevated buying activity on green days, signaling sustained trader interest.