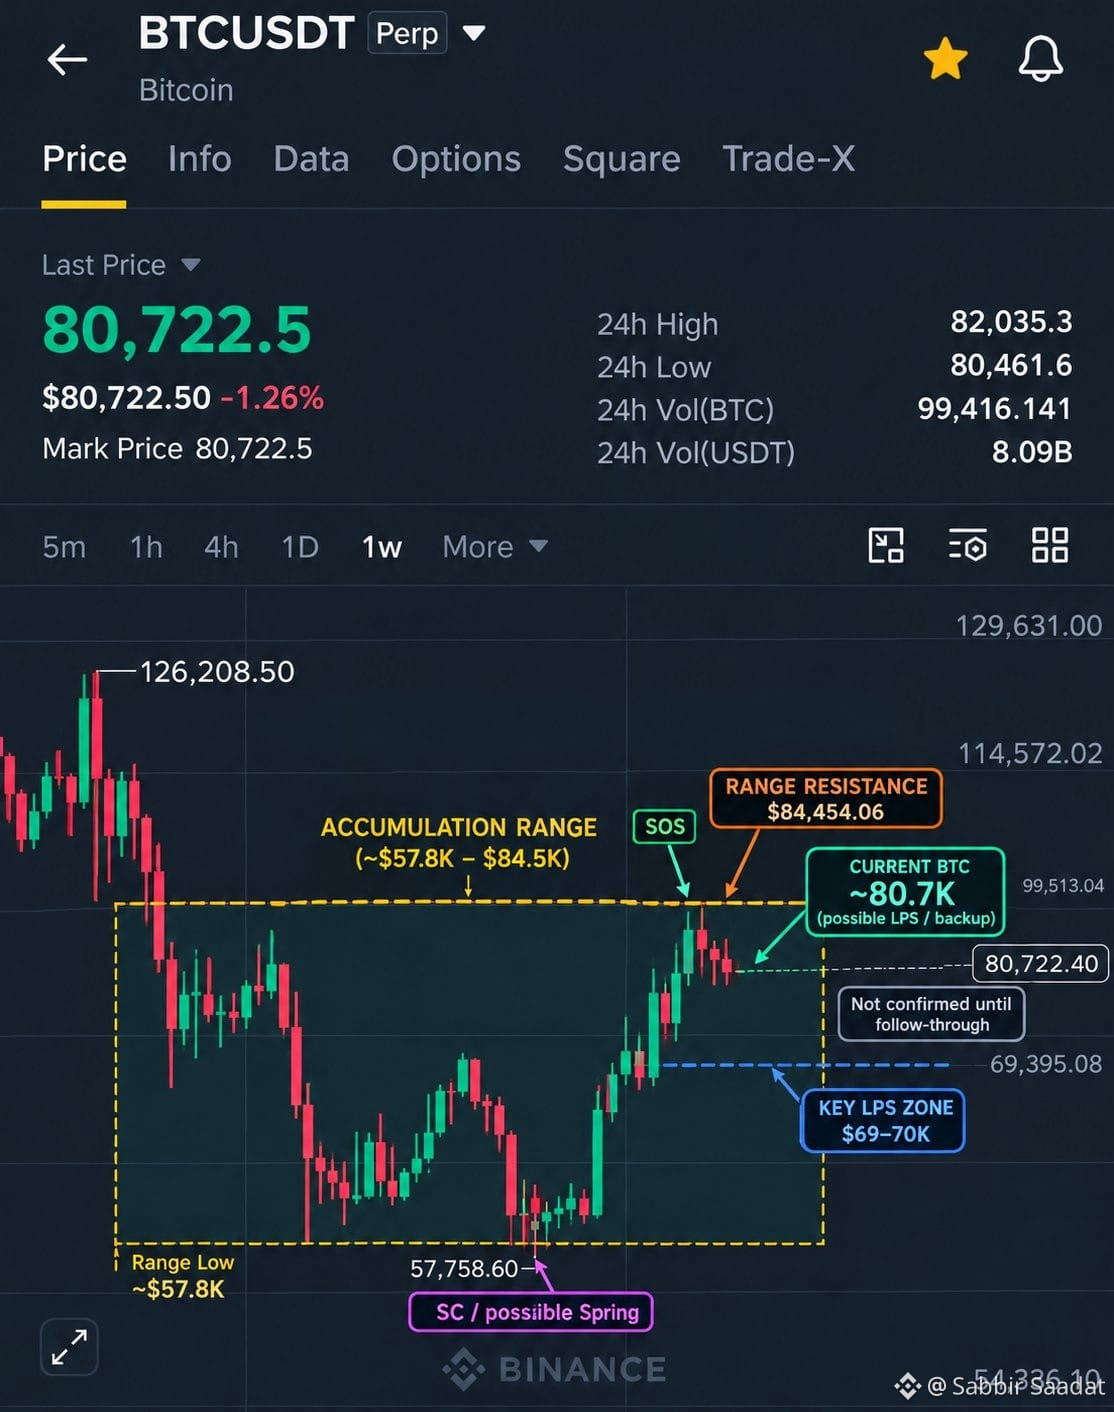

$BTC Weekly Analysis: Is Bitcoin Building a Wyckoff Accumulation Structure? 👀
Bitcoin’s weekly chart is showing an interesting setup, and I’m watching two levels closely: $69K and $84.5K.
After dropping from $126K to around $57.7K, BTC has spent a long period trading inside a broad range of approximately $58K–$85K.
From a Wyckoff perspective, this structure could suggest:
📍 $57.7K: Major range low and potential Spring
📍 $69K–$70K: Key support and potential LPS zone
📍 $84.5K: Major resistance and range high
📍 Above $84.5K: Stronger confirmation of a potential breakout
📍 Below $69K: Accumulation structure starts to weaken
📍 Below $57.7K: Bullish thesis would be invalidated
The recent rejection near $84.5K is the key area to watch.
If BTC holds support, forms a higher low, and eventually reclaims the range high, we could see a potential SOS → LPS → Markup sequence.
However, losing $69K decisively would weaken this scenario and force me to reassess the structure.
For now, I’m watching price action rather than predicting the outcome. Wyckoff is about understanding market behavior, not forcing a pattern onto the chart.
My key levels: $69K support and $84.5K resistance.
What do you think? Is BTC preparing for another breakout, or will it revisit the lower end of the range first?
#Bitcoin #BTC #CryptoAnalysis