


Cardano’s rebound from a major monthly support area has opened an interesting question about how much recovery room ADA could have. Christopher Inks shared the chart with a brief observation, but the price structure gives us much more to unpack.
The broader picture points to potential recovery levels well above the recent price. The daily chart, however, places Cardano at a support test that could decide whether its next move supports that bigger outlook.
Christopher Inks’ Monthly Cardano Chart Shows A Recovery From Major Support
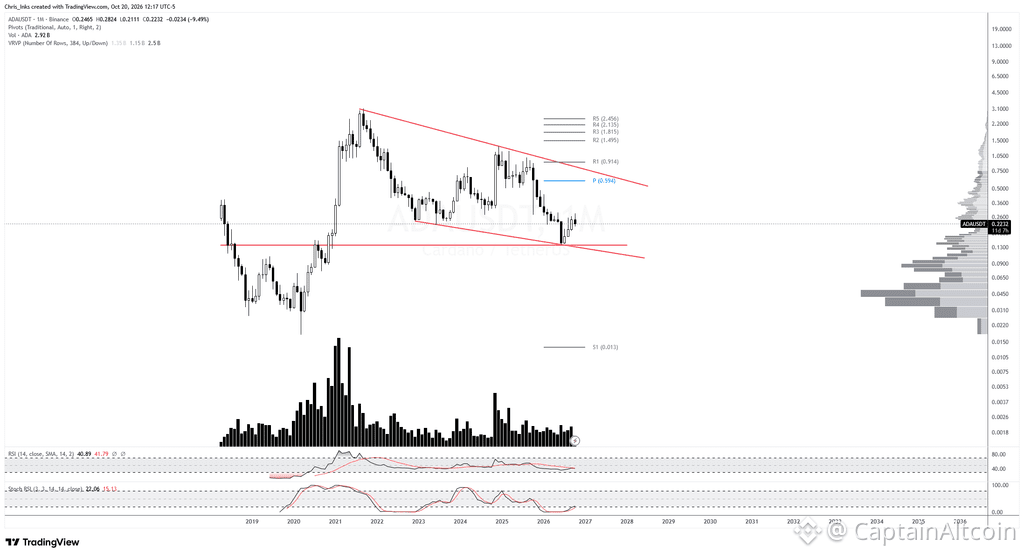
Christopher Inks, known as @TXWestCapital, described the monthly ADA chart as “interesting.” His post did not include a detailed price prediction, so the potential scenarios come from an interpretation of the chart he shared.
A look at the Cardano chart shows that ADA rebounded from roughly $0.13 to $0.14 earlier in 2026. That area matters because a horizontal support line meets the lower boundary of the broader descending structure there.
The rebound brought Cardano price back above $0.20, although the monthly snapshot still shows a difficult recovery. ADA remains beneath the descending resistance line that connects the major highs from previous market cycles.
That distinction matters when we assess the bullish case. Cardano has responded to support, but it still needs to recover several resistance levels before the chart supports a broader reversal.
 @TXWestCapital / X
The distance between those levels helps explain why this setup deserves a closer look. Even a partial recovery through the monthly structure would represent a substantial percentage move from the price displayed.
Cardano Price Has Several Resistance Levels Before A Recovery Toward $1
The monthly chart marks a central pivot near $0.594 and the first resistance pivot around $0.914. Those levels provide useful reference points for a recovery that could eventually bring ADA close to $1.
Cardano would first need to overcome the descending resistance line. Its exact value changes over time because the line slopes downward, so it should be treated as a moving barrier.
A sustained break above that boundary would strengthen the case for further recovery. ADA would then need to establish support above reclaimed levels instead of briefly crossing them before another retreat.
The chart also marks higher resistance pivots:
The next resistance levels appear near $1.495 and $1.815.
Further resistance levels appear around $2.135 and $2.456.
These are traditional pivot levels, rather than Fibonacci extensions. A Fibonacci projection would require separate anchor points and calculations that are not displayed on this chart.
A return toward the previous peak around $3 would therefore remain a more ambitious scenario. Cardano would need to clear the descending structure and the intervening resistance levels before that possibility becomes a stronger technical argument.
The monthly chart offers room for recovery, but it does not establish a deadline or guarantee a return to the previous high.
Cardano’s Daily Chart Places ADA Price At Rising Channel Support
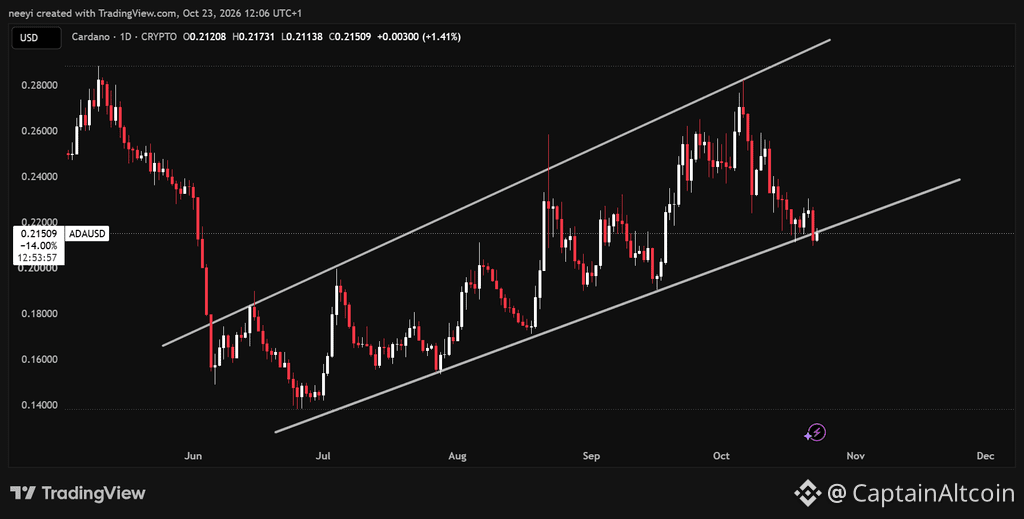
The daily chart brings the discussion back to a more immediate decision. Cardano has formed a sequence of higher lows since its June bottom, and the drawn ascending channel captures that broader recovery.
Recent price action has been less comfortable. ADA retreated from an early October high near $0.28 and returned to the lower channel boundary around $0.21 to $0.22.
 ADA Price Chart / TradingView.com
The supplied daily snapshot places Cardano price near $0.216. Several recent candles have tested the rising support line, and some have briefly crossed beneath it.
That makes confirmation especially important here. A strong response from this area would preserve the pattern of higher lows, but repeated weakness beneath the boundary would damage the recovery structure.
The chart therefore shows an upward trend under pressure, rather than an uninterrupted climb.
An ADA Price Bounce Could Deliver Around 30%, But A Breakdown Changes The Outlook
A recovery from approximately $0.216 toward the recent $0.28 high would represent an increase of about 30%. That makes the previous peak a practical reference for the bullish daily scenario.
Cardano would still need to work through the recent congestion around $0.24 to $0.26 before a retest becomes more convincing. A bounce alone would not confirm that the full move will follow.
Read Also: How High Could XRP Price Go? These Setups Are Looking Beyond $5
The downside scenario starts with a sustained loss of channel support. A decline of roughly 10% from the displayed price would bring ADA toward $0.194, close to a previous area of price activity.
Further weakness could expose the $0.17 to $0.18 region if buyers fail to establish support sooner.
FAQs
Will Cardano ADA reach $10?
Cardano (ADA) trading around $0.21 to $0.41 in 2026 would need to surge by over 2,400% to 4,500+% to reach $10, which mainstream prediction models and algorithms consider highly improbable in the near or medium term.
Will ADA go back to $1?
Cardano (ADA) trading around $0.27 needs a roughly 270% to 370% price increase to return to $1, which analysts view as possible only under specific market and network conditions.
Subscribe to our YouTube channel for daily crypto updates, market insights, and expert analysis.
The post This Analyst’s Cardano Price Prediction Could Surprise ADA Holders appeared first on CaptainAltcoin.