[OCTOBER 20 Bitcoin chart analysis]
BTCUSD 30Min Chart
*My analysis is optimized for TradingView.
If you press the replay button, you can check real-time movements.
-Neutral position strategy-
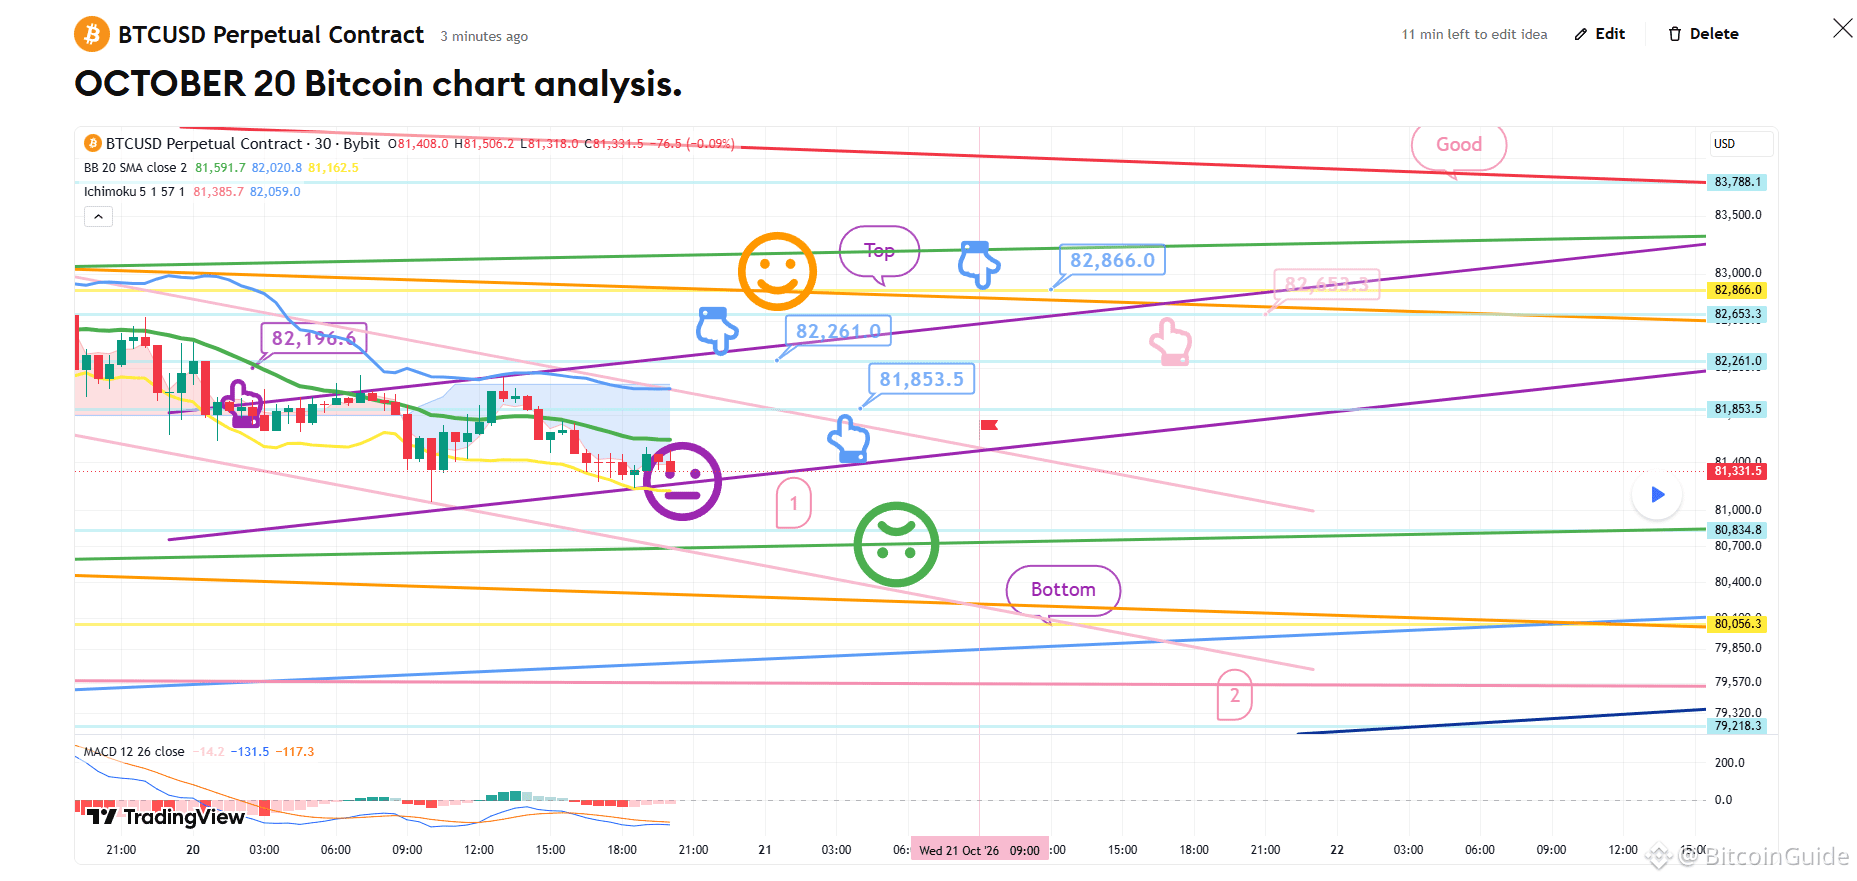
On the left, I have maintained the strategy for the long position entered on the 18th at $82,196.6 (indicated by the purple arrow).
Currently, a "dead cross" is unfolding on the 4, 6, 12 MACD settings.
*Following the path indicated by the light blue arrows:
This is a neutral, two-way strategy involving a switch from a short to a long position.
1) Short position entry at $82,261 (light blue arrow);
/ Stop-loss if the orange resistance line is broken.
2) Switch to a long position at $81,853.5;
/ Stop-loss if the purple support line is breached.
(If you are still holding the long position from the $82.1K level, the same stop-loss applies.)
3) Target levels follow the sequence: "Top" -> "Good."
If the price drops without touching the $82.2K short entry level (light blue arrow), look to enter a long position at the lower level (marked "1");
/ Stop-loss if the green support line is breached.
Please be aware that if the green support line is broken, the price could potentially move toward the "Bottom" level—down to the area marked "2."
Please treat this analysis as a reference only. Ensure you trade according to your own disciplined principles and always use stop-losses to keep your trading safe.
I post the analysis results as a Comment every day.
Thank you.
(You can find the link on my profile.)
- Click Follow to receive faster information every day.
- Check the results using the replay button on TradingView.
$USDT $ETH $XRP $BTC #Altcoin Season# #BNBChain# #BTC Price Analysis# #BTC100K