

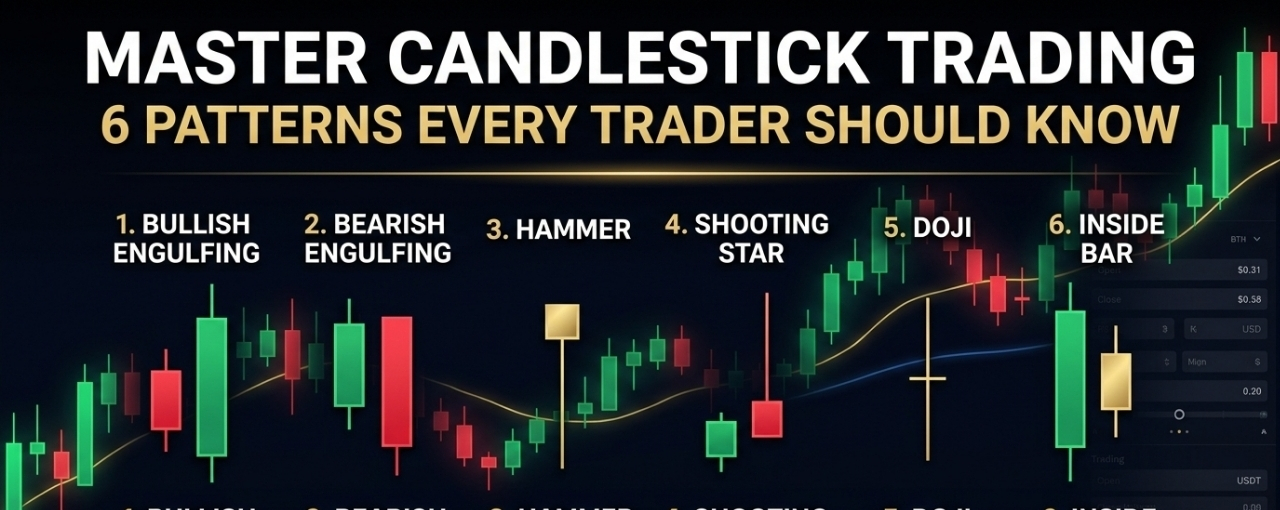

Learn to Read Price Action Instead of Guessing the Market 📊
Have you ever seen a green candle and expected the price to rise, only to watch the market reverse? Or spotted a long wick and wondered whether buyers or sellers were taking control?
Understanding candlestick charts is an important step toward understanding market behavior. But successful technical analysis requires more than memorizing candle shapes.
In this educational guide, we’ll explore 11 common candlestick patterns, five practical trading techniques, multi-timeframe analysis, and essential risk-management principles.
1. Understanding the Anatomy of a Candlestick
Every candlestick displays four important price points:
Open: The price at which the candle begins.
High: The highest price reached during the period.
Low: The lowest price reached during the period.
Close: The price at which the candle finishes.
The candle body represents the distance between the opening and closing prices. The wicks show how far price moved beyond the body.
A bullish candle closes above its open, while a bearish candle closes below its open. Chart colors can be customized, so always check your chart settings.
Important: A candle represents activity during a specific timeframe. A 15-minute candle and a daily candle can tell different stories about the same market.
2. Eleven Candlestick Patterns Every Trader Should Understand
1. Hammer — Potential Bullish Reversal
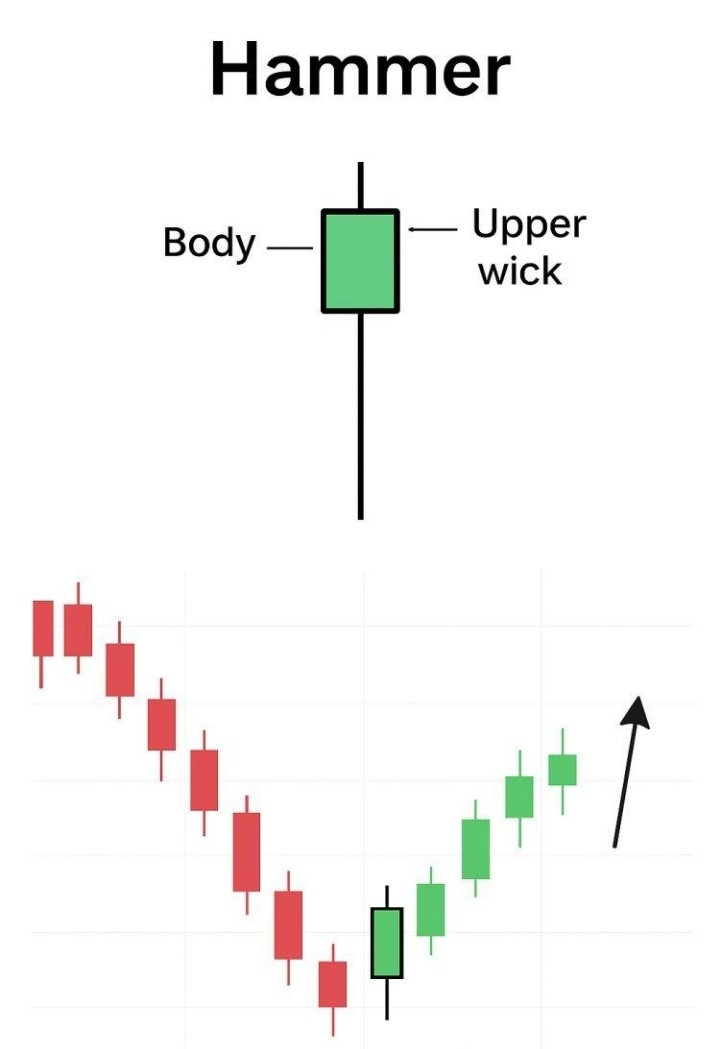
A hammer has a small body near the top of its range and a long lower wick.
What it may indicate: Sellers pushed the price lower, but buyers helped recover some of that decline.
How traders analyze it: Look for the pattern near a support zone after a downtrend. Confirmation may come from a subsequent bullish candle.
A hammer in the middle of a sideways market may be less meaningful.
2. Shooting Star — Potential Bearish Reversal
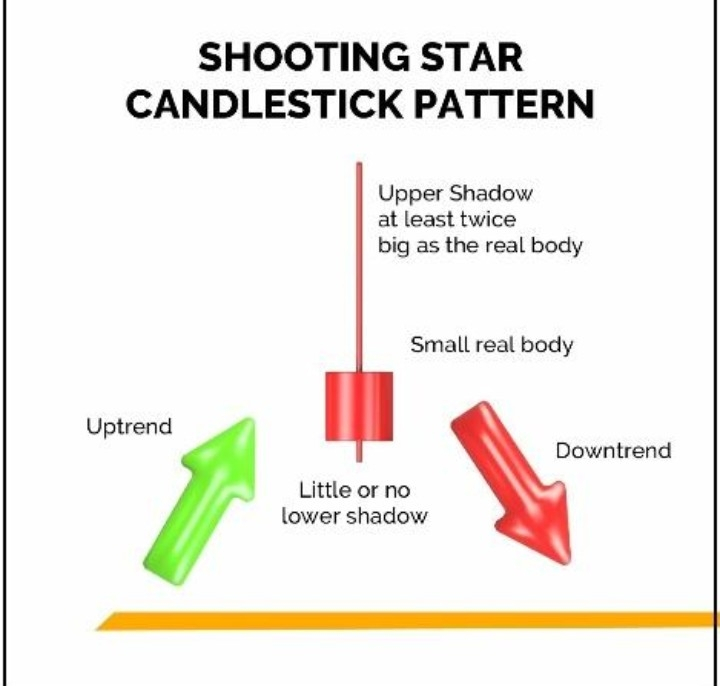
A shooting star has a small body near the bottom of its range and a long upper wick.
What it may indicate: Buyers pushed the price higher, but selling pressure returned before the candle closed.
How traders analyze it: Examine whether it appears near resistance after an uptrend. A subsequent bearish candle can provide additional evidence.
3. Bullish Engulfing — Buyers May Be Gaining Strength
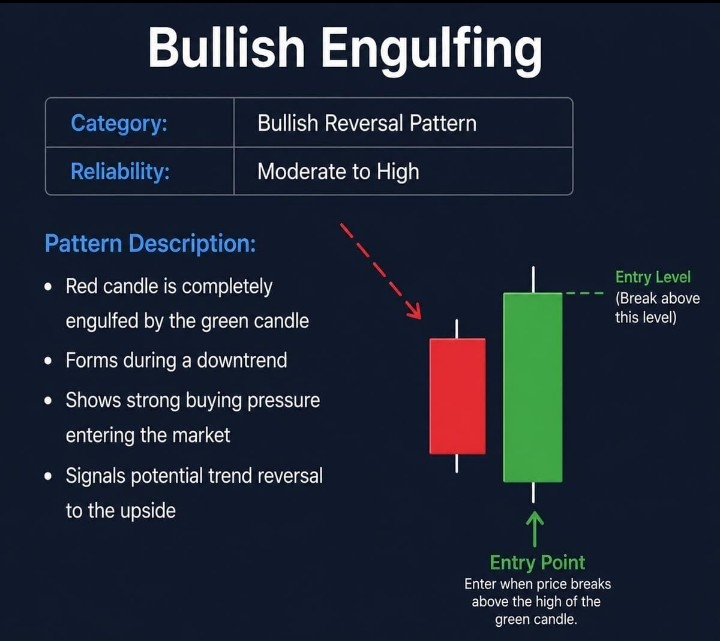
This pattern consists of a bearish candle followed by a bullish candle whose body engulfs the previous candle's body.
What traders look for:
A relevant support area.
A completed bullish engulfing candle.
Confirmation from subsequent price action or volume.
The pattern may suggest a change in momentum, but it does not guarantee that the market will rise.
4. Bearish Engulfing — Sellers May Be Gaining Strength
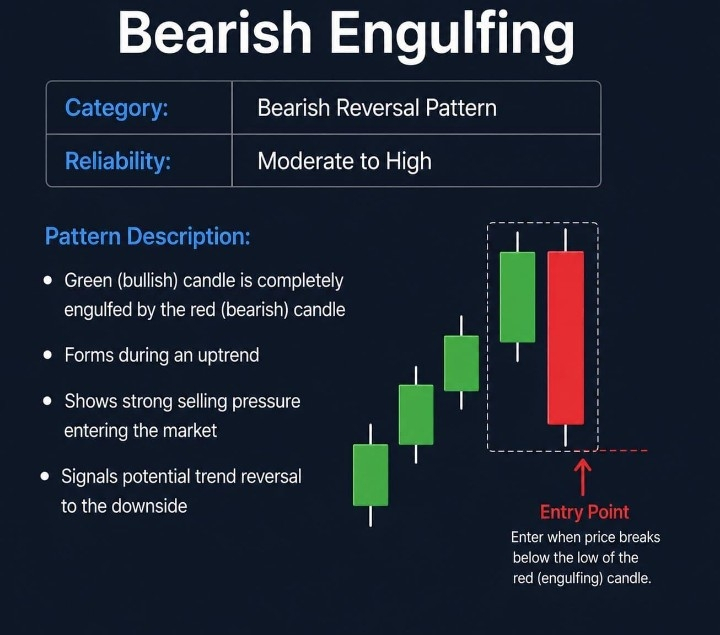
A bearish candle's body engulfs the preceding bullish candle's body.
This pattern can be useful when studying possible bearish reversals near resistance or after an extended upward move.
Traders may examine the following candle, nearby support, and market structure before interpreting the pattern.
5. Doji — Market Indecision
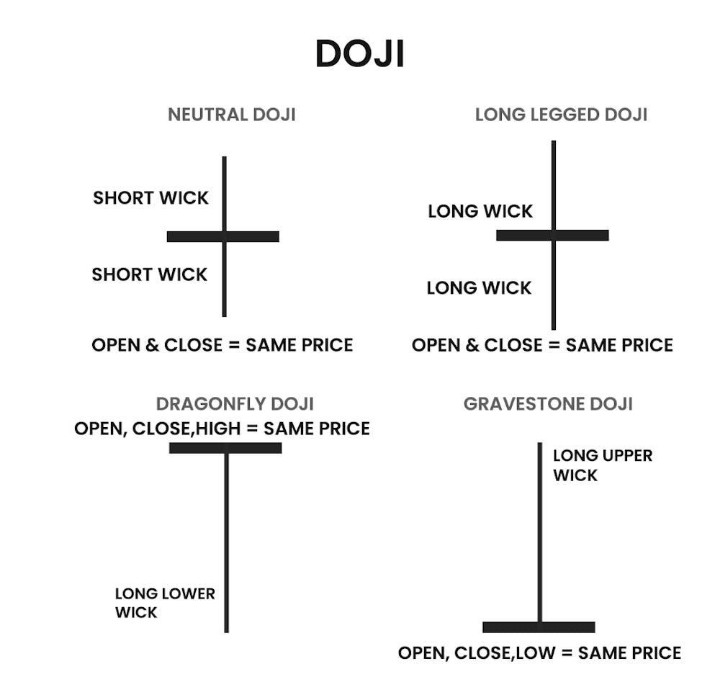
A Doji forms when the opening and closing prices are very close.
It can reflect indecision between buyers and sellers.
A Doji alone is not a reliable directional signal. Its meaning depends on where it appears, what happened before it, and how price behaves afterward
6. Marubozu — Strong Directional Movement
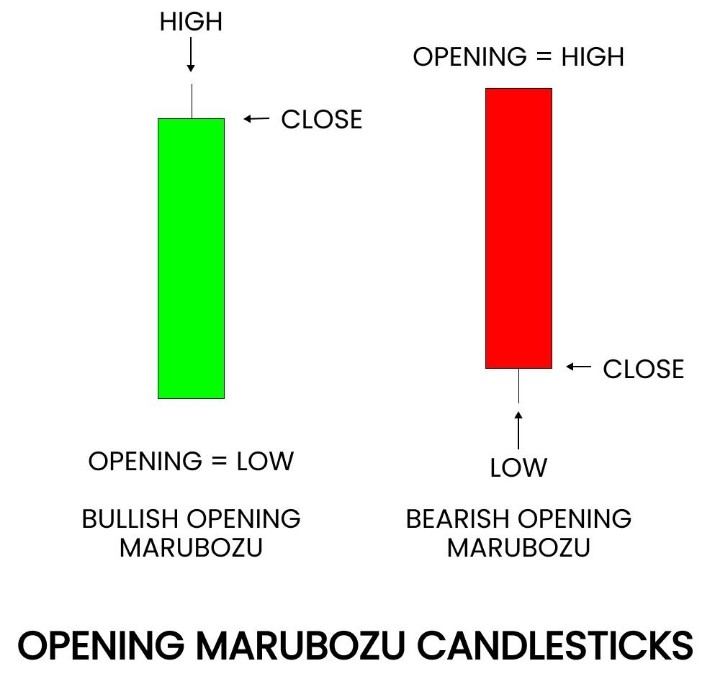
A Marubozu is a candle with a large body and little or no wick.
A bullish Marubozu shows strong upward movement during the candle period. A bearish Marubozu shows strong downward movement.
Traders may use these candles to assess momentum or breakout strength, while avoiding impulsive entries after an unusually large move.
7. Inverted Hammer — Possible Bullish Reversal
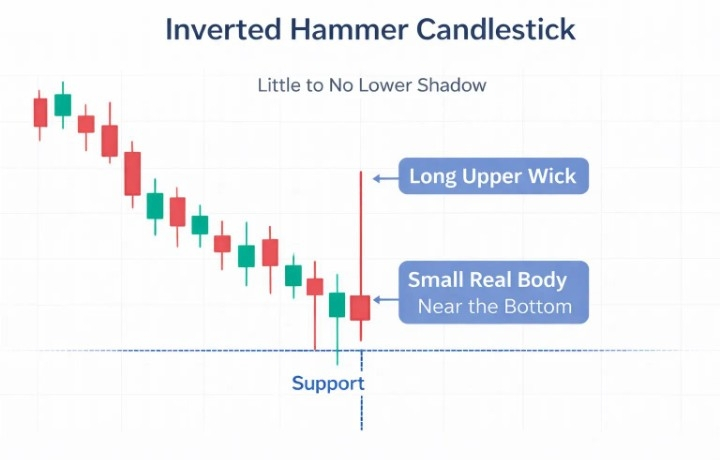
This pattern has a small body near the lower part of its range and a long upper wick.
When it appears after a decline, it may indicate an attempt by buyers to push prices higher.
A bullish follow-through candle can help traders evaluate whether that attempt gained traction.
8. Hanging Man — Potential Warning After an Uptrend
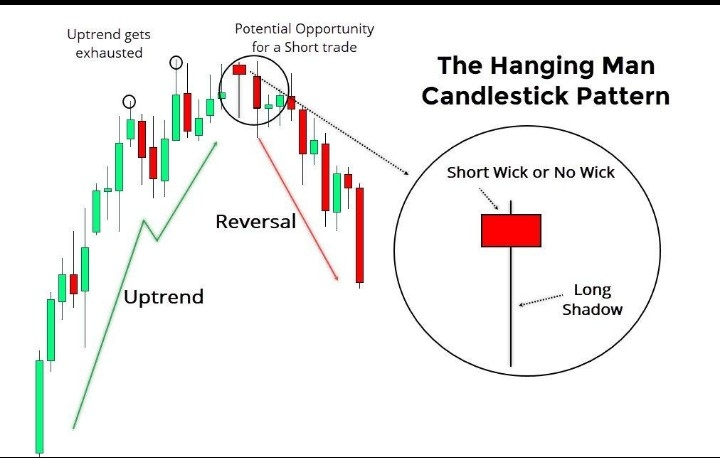
The Hanging Man resembles the Hammer but occurs after an upward move.
Its long lower wick suggests that prices experienced selling pressure during the candle period.
It is a warning to examine market conditions, not proof that a reversal has begun. Bearish confirmation can strengthen the interpretation.
9. Three White Soldiers — Sustained Bullish Momentum
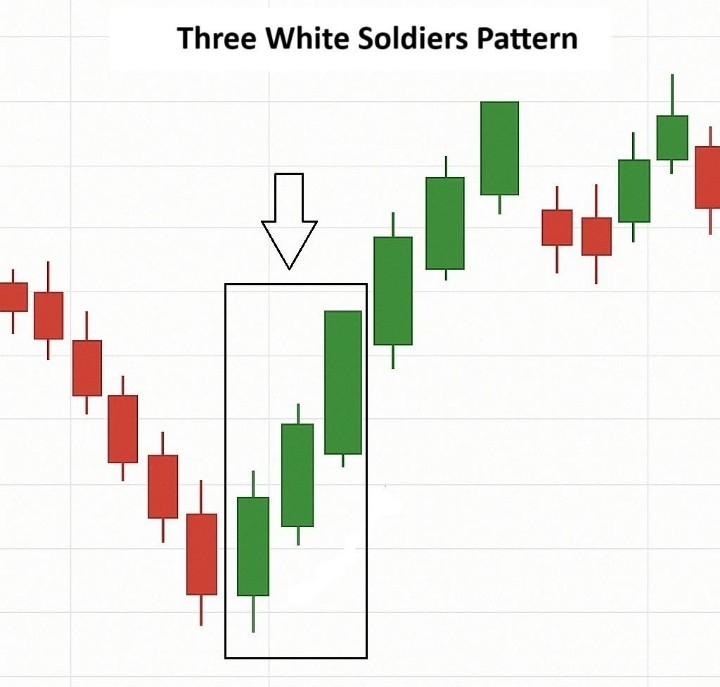
This pattern consists of three consecutive bullish candles, often with relatively strong bodies.
It can indicate sustained buying pressure after a decline or consolidation.
However, when the pattern appears after an already substantial rally, the market may be extended. Context matters more than the pattern's name.
10. Three Black Crows — Sustained Bearish Momentum
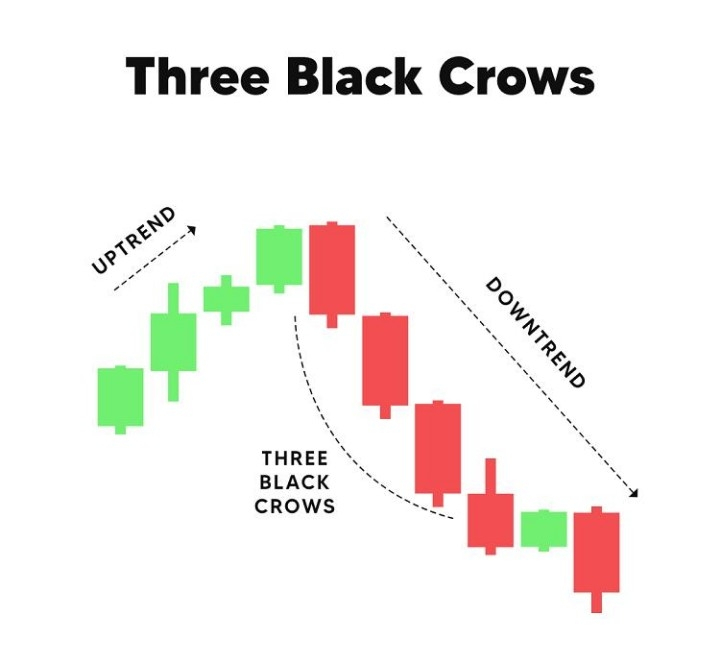
Three consecutive bearish candles may indicate persistent selling pressure.
Traders often examine whether the pattern develops after an uptrend and whether price breaks important support.
A sequence of bearish candles can also appear during an established downtrend, so it does not automatically signal a fresh reversal.
11. Inside Bar — Consolidation Before a Possible Breakout
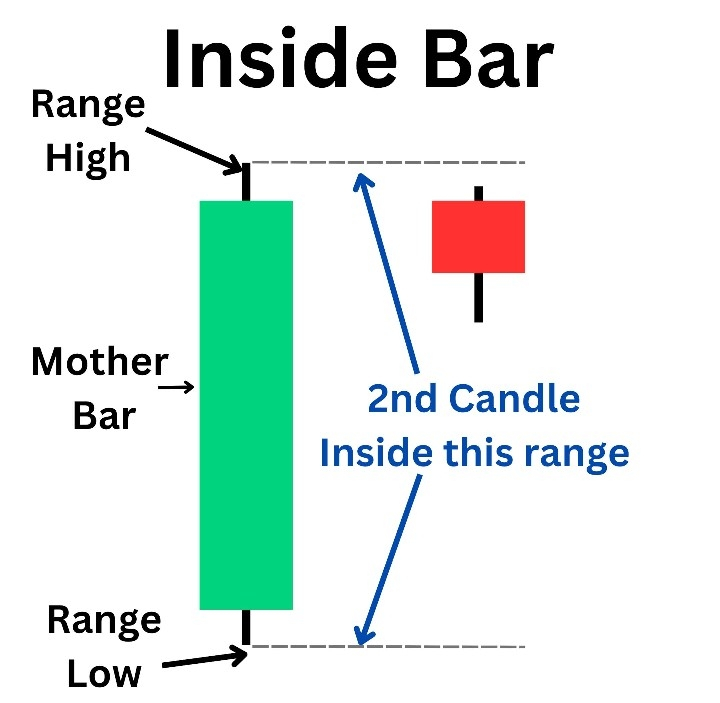
An Inside Bar forms when the candle's high and low remain within the preceding candle's range, commonly called the mother bar.
It suggests a period of consolidation or reduced price range.
A breakout above the mother bar's high or below its low may indicate a directional move, but false breakouts are possible in either direction.
3. Five Practical Candlestick Trading Techniques
Candlestick patterns become more useful when combined with market structure and clearly defined rules.
Technique 1: Support + Hammer
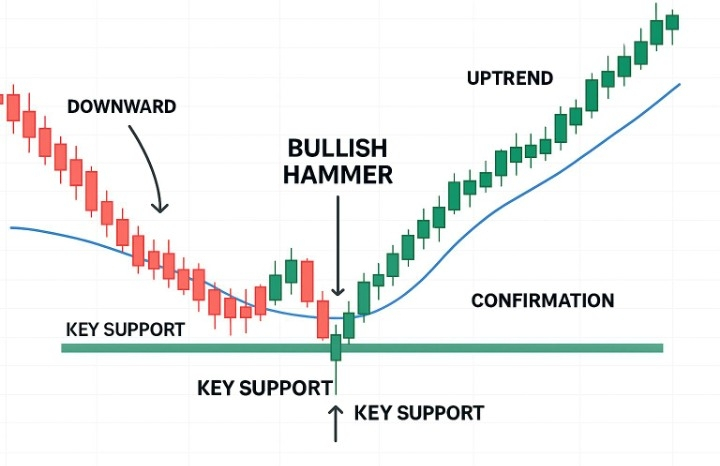
Objective: Study a possible bullish reversal.
Identify a support zone using previous price reactions.
Wait for price to approach the zone.
Look for a hammer or another bullish rejection pattern.
Wait for the candle to close and assess confirmation.
Define a possible entry, invalidation level, and target before taking any trade.
A stop-loss may be placed below the relevant swing low, with an appropriate buffer based on market volatility and trading costs.
Technique 2: Resistance + Bearish Engulfing
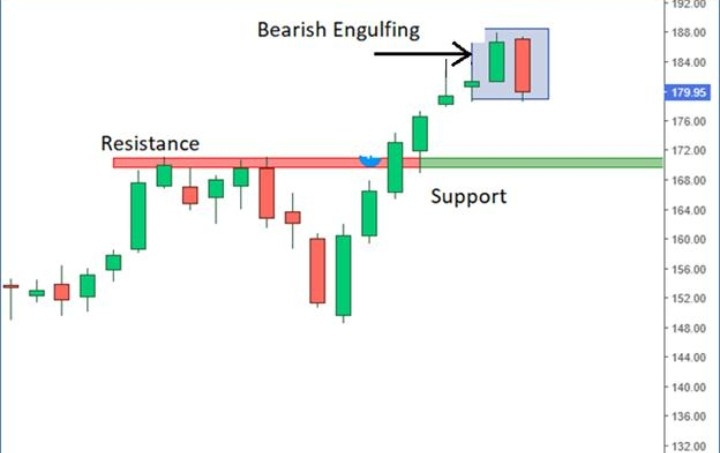
Objective: Study a possible bearish reversal.
Identify a resistance zone.
Observe price as it approaches that area.
Look for a completed bearish engulfing pattern.
Examine subsequent price action for confirmation.
Define the trade's invalidation level and potential target.
Short selling carries additional risks. In leveraged crypto markets, liquidation can occur if price moves against a position.
Technique 3: Breakout + Retest
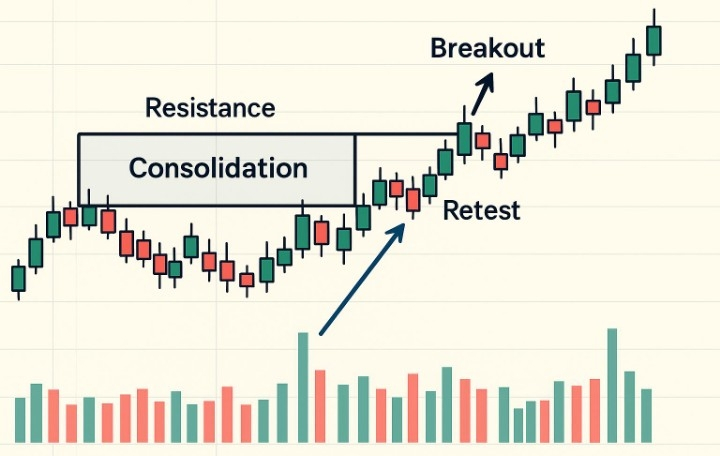
Objective: Analyze a possible move beyond a key price level.
Mark a clear support or resistance area.
Wait for a candle to close beyond the level.
Observe whether price returns to test the breakout zone.
Look for evidence that the broken level is holding.
Plan risk around the price structure that would invalidate the setup.
Not every breakout gets a retest, and not every retest succeeds. Avoid assuming that a brief move beyond a level confirms a genuine breakout.
Technique 4: Trend Continuation
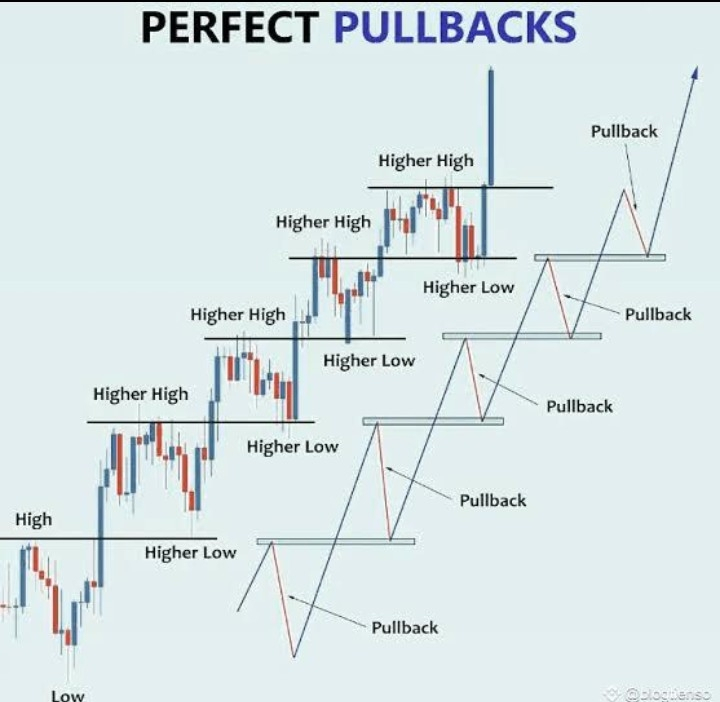
Objective: Study opportunities within an established trend.
In an uptrend, traders may observe higher highs and higher lows. In a downtrend, they may observe lower highs and lower lows.
A typical analysis process is:
Determine the broader trend.
Identify a pullback toward a relevant price area.
Observe whether the trend resumes.
Look for a candle pattern consistent with that movement.
Define risk before considering an entry.
This approach can help traders avoid interpreting every pullback as a complete reversal.
Technique 5: Candlestick + Volume
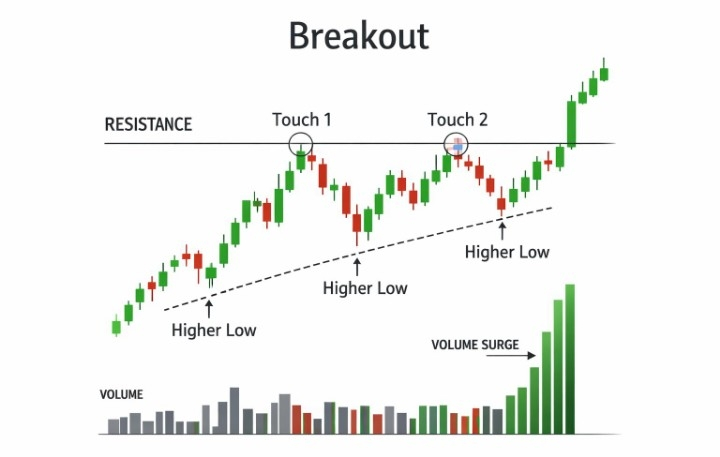
Objective: Assess the strength of a price movement.
Volume can provide additional context for a breakout or reversal.
For example, a breakout accompanied by rising volume may show greater participation than a breakout occurring on weak volume. However, volume is not a guarantee of continuation.
Consider the candle's closing position, the nearby price levels, the prevailing trend, and the possibility of a false breakout.
4. Which Timeframe Should You Use?
Different timeframes serve different analytical purposes.
1-minute to 5-minute: Very short-term price movements; considerable noise and transaction costs.
15-minute: Intraday setups and short-term price action.
1-hour: Intraday structure and developing trends.
4-hour: Broader short-term trends and potential swing setups.
Daily: Larger market structure and longer-term price behavior.
One educational approach is to examine the 4-hour chart for the broader structure and then use the 15-minute or 1-hour chart to study potential entries.
The lower timeframe should not be treated as independent of the larger trend. A bullish pattern on a short timeframe can occur during a broader downtrend.
5. A Complete Example: Bullish Engulfing at Support
Consider a hypothetical market in which price approaches a previously identified support zone.
Step 1 — Context: Price has been declining toward support.
Step 2 — Pattern: A bullish candle forms and engulfs the preceding bearish candle's body.
Step 3 — Confirmation: The candle closes, and subsequent price action is examined to see whether buyers maintain control.
Step 4 — Risk definition: A potential invalidation level is identified below the relevant price structure.
Step 5 — Target assessment: The next resistance area is considered as a possible target.
Step 6 — Evaluation: The potential reward is compared with the amount at risk, including fees and other trading costs.
This is an illustrative scenario, not a live market setup or a recommendation to enter a position. No trade is guaranteed to succeed.
6. Risk Management: The Part Traders Often Overlook
Even a well-defined strategy will experience losing trades.
Risk management helps prevent one unsuccessful trade from causing disproportionate damage to an account.
Consider these principles:
Risk only a small, predefined portion of your capital on an individual trade. Some traders use 0.5%–1% as a learning guideline, not a universal rule.
Calculate position size based on the distance to the stop-loss.
Understand that stop-loss execution may differ from the intended price during rapid market movements.
Account for fees, funding costs where applicable, and slippage.
Avoid excessive leverage and understand liquidation mechanics before trading derivatives.
Keep a trading journal and evaluate performance over a meaningful sample of trades.
For example, if an account contains $1,000 and the planned risk is 1%, the intended monetary risk is $10 before fees and slippage.
That does not mean the position size should be $10. Position size depends on the entry price, stop-loss distance, and instrument being traded.
7. Common Candlestick Trading Mistakes
Mistake 1: Trading every pattern.
A candle pattern without relevant market context can produce misleading signals.
Mistake 2: Entering before the candle closes.
The candle's appearance can change significantly before its timeframe ends.
Mistake 3: Ignoring support and resistance.
The same pattern can have different implications depending on where it appears.
Mistake 4: Using excessive leverage.
A small adverse price movement can cause substantial losses in leveraged positions.
Mistake 5: Moving stop-losses emotionally.
Changing risk rules after entering a trade can turn a controlled loss into a much larger one.
Mistake 6: Judging a strategy from one trade.
A strategy needs systematic testing rather than selective examples.
8. How to Practice Before Trading Real Money
A structured learning process can help you determine whether a strategy is worth further investigation.
Choose a specific market and timeframe.
Write down the exact conditions required for a setup.
Review historical charts without selecting only successful examples.
Record every qualifying setup, including failures.
Include trading fees and realistic assumptions about execution.
Evaluate win rate, average win, average loss, drawdown, and consistency.
Practice in a simulated environment before considering real capital.
A pattern that looks convincing on a few screenshots may perform very differently across a larger sample of market conditions.
Final Thoughts
Candlestick trading is not about predicting every price movement. It is about interpreting price behavior, understanding context, defining risk, and making decisions according to consistent rules.
Start by learning a few patterns thoroughly—such as the Hammer, Engulfing patterns, Doji, and Inside Bar. Then combine them with support and resistance, trend analysis, and disciplined risk management.
The goal is not to find a perfect candle. The goal is to develop a repeatable process and understand its limitations.
💬 Discussion question: Which approach do you find most useful for studying price action: support and resistance, breakout and retest, or trend continuation?
Share your experience and explain your reasoning.
Disclaimer: This article is for educational and informational purposes only. It is not financial or investment advice and does not recommend buying, selling, or holding any cryptocurrency. Crypto markets are volatile, and trading can result in the loss of some or all of your capital. Always conduct your own research (DYOR) and assess your risk tolerance before making financial decisions.