

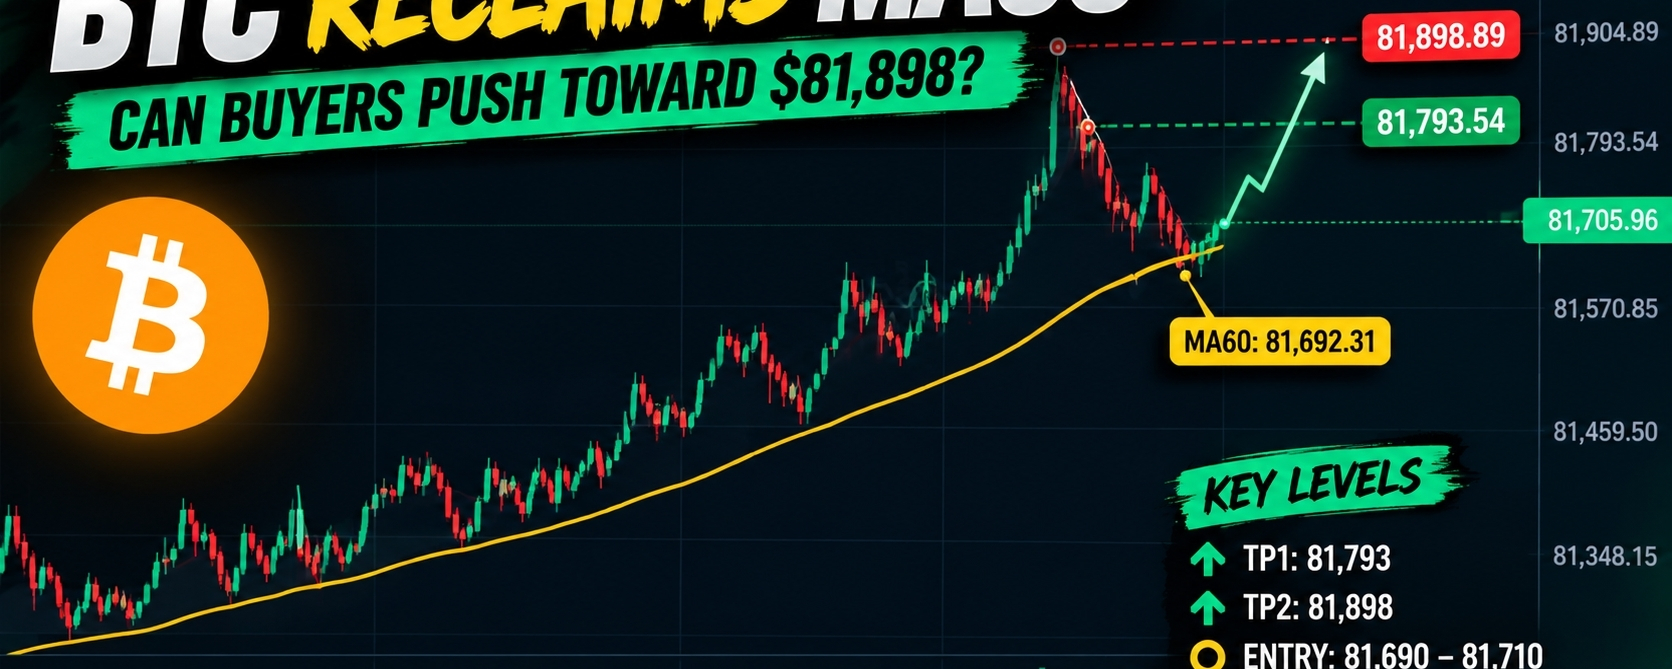

I’m looking at $BTC around 81,705.96, where price has recovered from the recent dip and is pushing back toward the MA60 at 81,692.31. The short-term structure is leaning bullish, but I’d like to see whether buyers can hold this area before considering a long entry.
Price previously spiked toward the visible 81,897.89 daily high before pulling back. It has since recovered, but that rejection means I’m not chasing the move blindly. The MA60 is the key reference on this chart, while 81,793.54 and the recent high near 81,897.89 are visible upside resistance areas.
Trade idea:
📍 Entry: 81,690–81,710, only if price holds above the MA60
🎯 TP1: 81,793
🎯 TP2: 81,898
🎯 TP3: Not justified by the visible chart
🛑 Invalidation: A clear move back below 81,570
The long idea depends on BTC maintaining support around the MA60 and building momentum toward the previous high. Losing that average and breaking lower would weaken the setup, especially if price slips below the recent recovery structure.
Volume shows a recent spike, but I’d want stronger confirmation before treating this as a clean breakout.
My approach: I’m watching the reaction around 81,692 first. If buyers defend it, the previous high becomes the next area of interest. If not, I’m happy to wait rather than force a trade.