


Amp (AMP) is gaining market attention after a strong upward move. According to the latest Binance screenshots, AMP/USDT is trading near $0.000769, up approximately 24.03% over 24 hours, with reported 24-hour USDT volume of around $9.54 million.
The rally has pushed price above its displayed moving averages on both the 1-hour and daily charts. But with AMP approaching the recent high, the next question is whether buyers can extend the move or whether profit-taking will trigger a pullback.
📊 1H Chart: Bullish Momentum
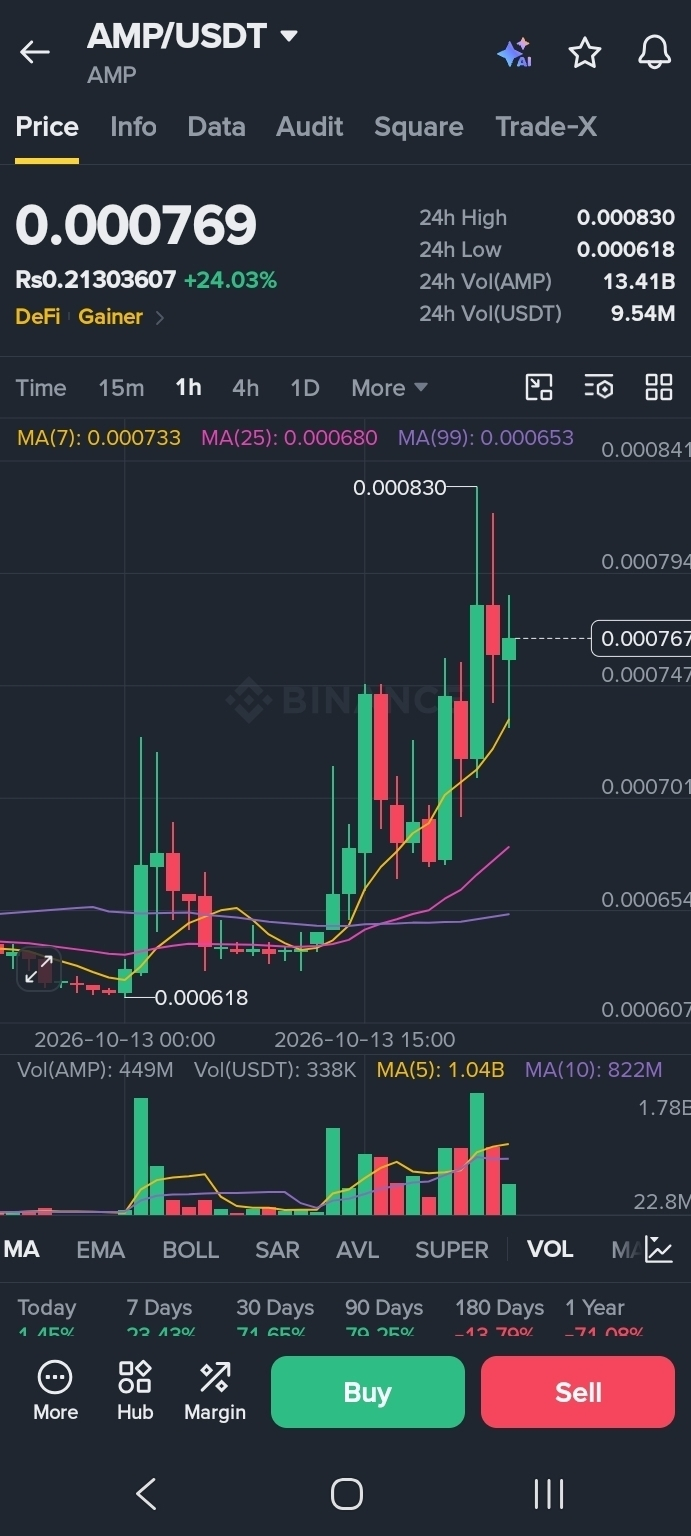
The 1-hour chart shows AMP trading above all three moving averages:
MA(7): $0.000733
MA(25): $0.000680
MA(99): $0.000653
This alignment supports the current short-term bullish structure. The first test is whether AMP can hold the $0.000733–$0.000747 area and build momentum toward the recent high.
A break above $0.000830 would put the $0.000841–$0.000892 region in focus, although a breakout needs confirmation from price action and volume.
📈 1D Chart: Recovery Structure Strengthens
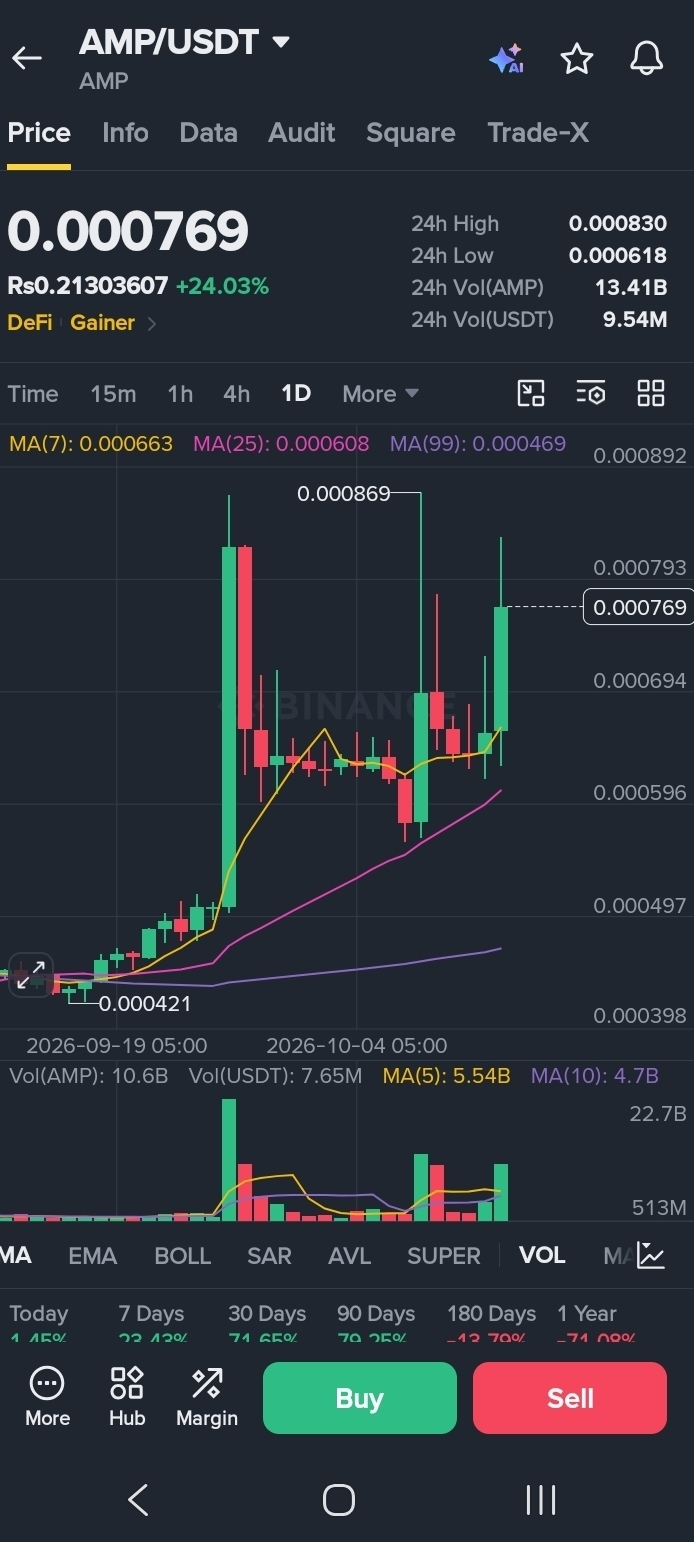
The daily chart also shows price above its displayed moving averages:
MA(7): $0.000663
MA(25): $0.000608
MA(99): $0.000469
This suggests a strong recovery relative to these averages. However, a sharp 24-hour rally can attract sellers, and moving averages cannot predict the next move on their own.
🎯 Key Levels to Watch
Resistance
$0.000830 — recent 24-hour high
$0.000841–$0.000892 — higher visible chart levels
Support
$0.000733–$0.000747 — near-term support area
$0.000680–$0.000694 — next support zone
$0.000618–$0.000663 — broader pullback area
These are reference levels from the supplied screenshots, not guaranteed turning points.
🔍 Two Possible Scenarios
Bullish scenario: If AMP holds above the near-term support zone and breaks through $0.000830 with sustained buying volume, the market may test higher resistance around $0.000841–$0.000892.
Bearish scenario: If the rally loses momentum and AMP falls below $0.000733, a pullback toward $0.000680 becomes possible. A deeper decline could bring the $0.000618–$0.000663 zone into focus.
💡 Final Thoughts
AMP currently shows bullish momentum on both the 1H and 1D charts. Still, after a gain of more than 24% in 24 hours, chasing the rally carries significant risk.
The key is to watch whether buyers can defend support and whether a move above resistance is confirmed by volume.
Would you wait for a confirmed breakout above $0.000830, or look for a pullback before considering AMP? Share your view below.
Disclaimer: This article is for educational purposes only and is not financial advice. Cryptocurrency markets are volatile. Always do your own research and manage risk carefully.
#AMP #AMPUSDT #AmpToken #CryptoAnalysis #BinanceSquare #TechnicalAnalysis #DeFi #Altcoins #cryptotrading