
DAILY SIGNAL — SOL/USDT
Date: 11 Oct 2026
Timeframe: 1m
Intraday Bias: Resistance test → potential bullish continuation or rejection
📊 Market Bias
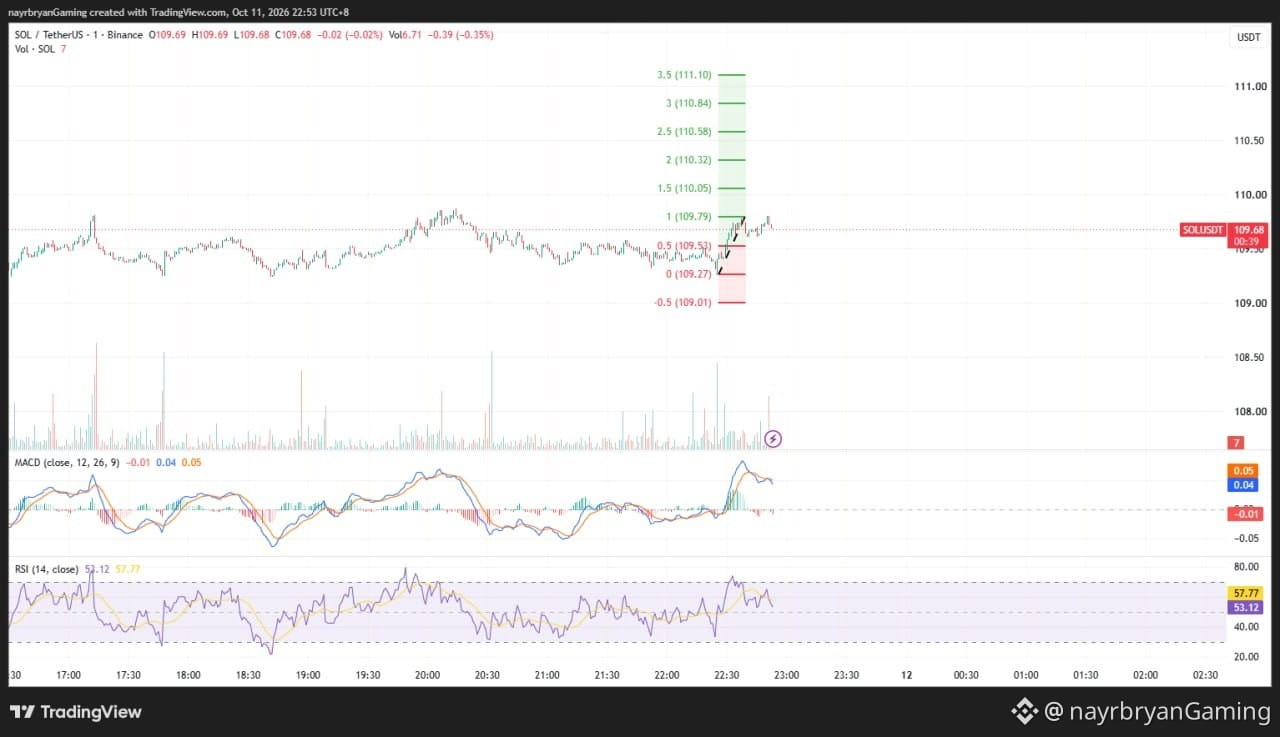
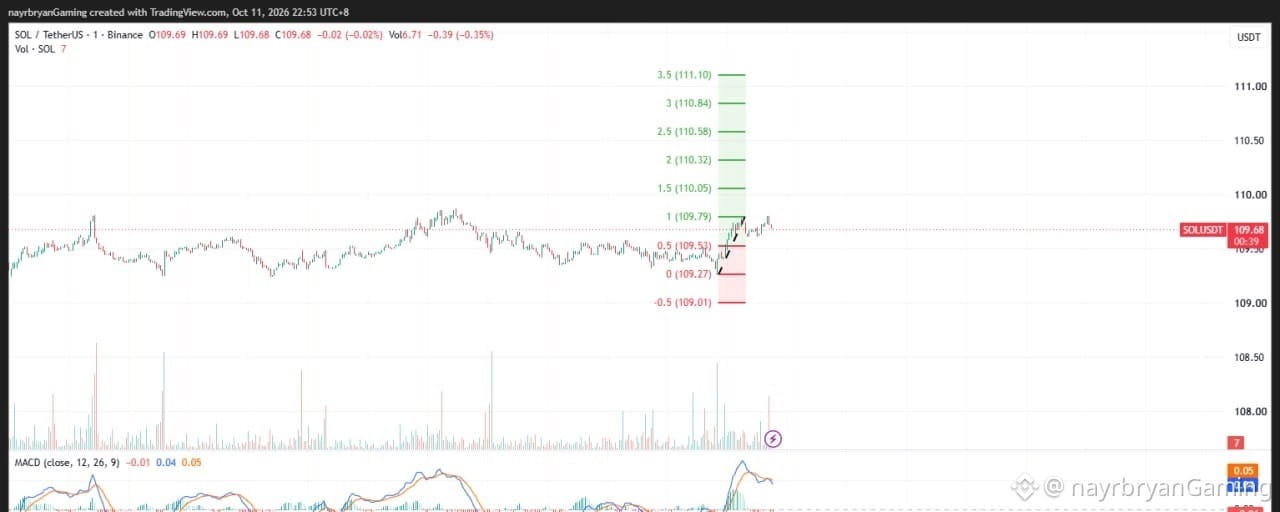
SOL is trading around 109.67 USDT, testing a major horizontal resistance zone around 109.80–109.95 within a broader converging price structure.
Price has rallied into the purple supply/resistance zone, where previous reactions suggest sellers may become active. The latest move shows short-term bullish momentum, but the resistance test is not yet confirmed as a breakout.
MACD remains positive overall, although momentum is beginning to cool. RSI is around 58.10, indicating positive momentum without being deeply overbought.
The key question is whether SOL can secure a clean breakout above resistance or gets rejected back toward the lower boundary of the range.
🔹 Key Levels (from chart)
Resistance / Breakout Zone:
109.80–109.95
Immediate Support:
109.50–109.55
Major Structural Support:
109.10–109.25
Breakout Confirmation:
A sustained move above 109.95, preferably followed by a successful retest.
🎯 Potential Upside Targets
TP1 → 110.05
TP2 → 110.32
TP3 → 110.58
TP4 → 110.84
TP5 → 111.10
🔻 Downside Levels if Rejected
Support 1 → 109.50
Support 2 → 109.25
Support 3 → 109.10
These are conditional chart levels, not guaranteed price destinations.
📈 Technical Breakdown
Bullish scenario: If SOL breaks above 109.95 and holds the zone on a retest, buyers may attempt to push toward 110.05 and the higher Fibonacci extension levels.
Bearish scenario: If price fails to reclaim resistance and drops below 109.50, the move may retrace toward 109.25–109.10.
The chart currently shows price pressing into resistance rather than a fully confirmed breakout. Waiting for a candle close and retest may help avoid chasing a short-lived spike.
🧠 Quick Insight
“Resistance is where momentum must prove itself. A strong move is not confirmed until price can hold above the level.”
⚠️ Disclaimer
This is personal technical analysis for educational purposes only, not financial advice or a guaranteed trading signal. The chart reflects a 1-minute snapshot, and conditions can change rapidly. Always DYOR / DYODD, define your invalidation before entering, and manage risk carefully.
— @nayrbryanGaming
#SOL #SOLUSDT #Crypto #Binance #TechnicalAnalysis #PriceAction #Fibonacci #TradingView #Scalping #DYOR #NFA #SAP #DYODD #NOFOMO