


Ethereum Classic (ETC) is showing a modest recovery, with ETC/USDT trading around $8.43, up approximately 1.44% in the latest Binance screenshots.
The price is moving near its short-term moving averages, but the daily chart tells a more cautious story. Is ETC preparing for a stronger recovery, or does resistance still stand in the way?
📊 1H Chart: Short-Term Stabilization
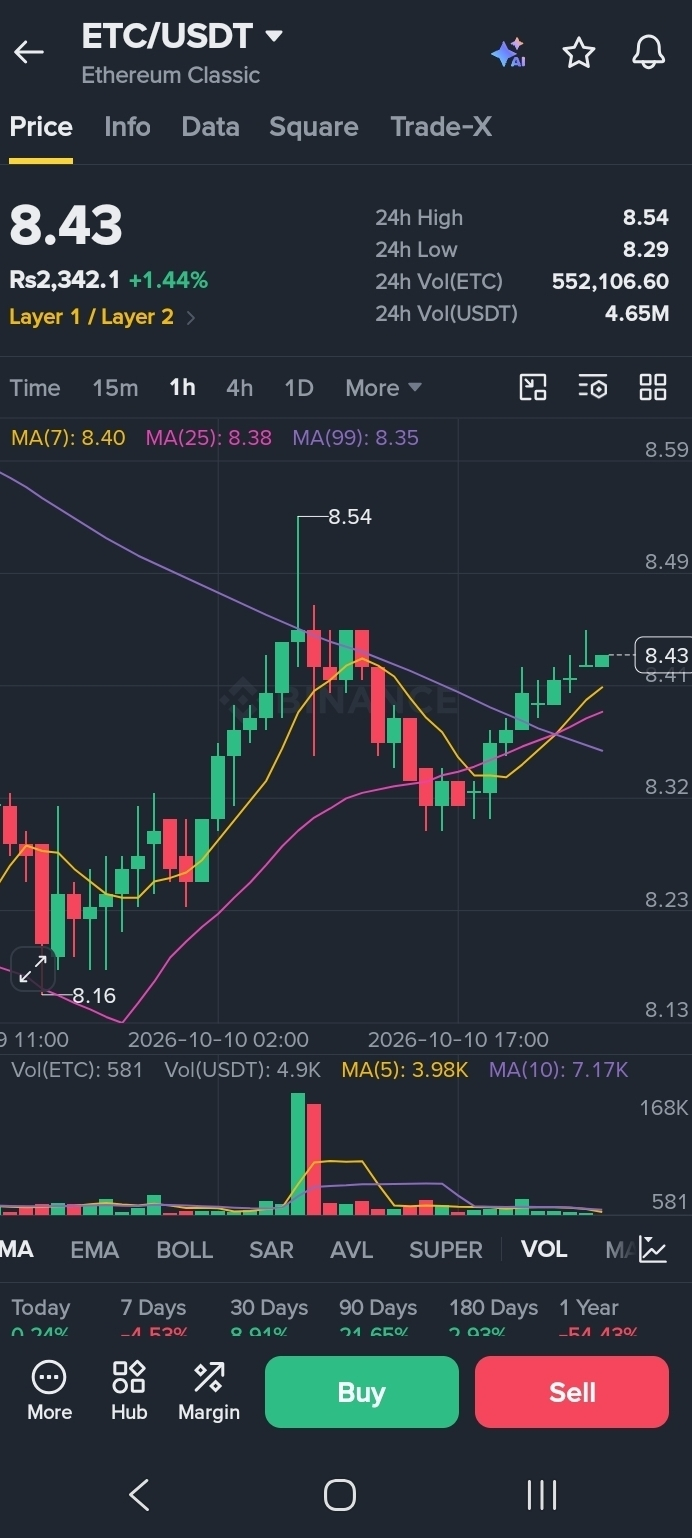
The 1-hour chart shows ETC trading slightly above its three moving averages:
MA(7): $8.40
MA(25): $8.38
MA(99): $8.35
This suggests short-term stabilization with a mild bullish bias. However, the moving averages are close together, so stronger momentum is still needed to confirm a meaningful breakout.
Resistance to watch: $8.49–$8.54.
A sustained move above this area could strengthen the recovery attempt. Failure to break through may keep ETC range-bound.
📈 1D Chart: Recovery Still Needs Confirmation
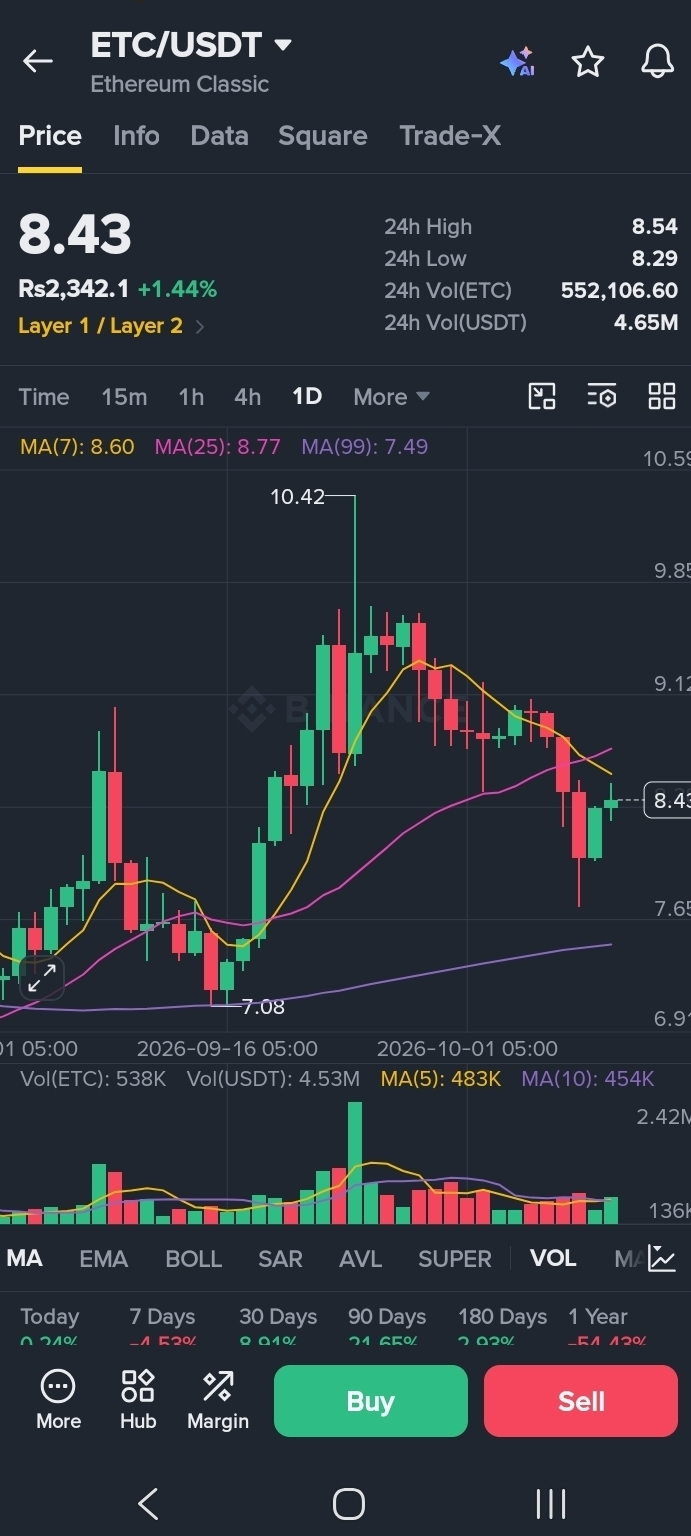
The daily chart shows a more cautious setup:
MA(7): $8.60
MA(25): $8.77
MA(99): $7.49
At $8.43, ETC remains below the 7-day and 25-day moving averages but above the 99-day average.
This means the short-term recovery has not yet confirmed a stronger daily trend reversal. A move above $8.60 and then $8.77 would improve the technical picture.
🎯 Key Price Levels
Resistance
$8.49–$8.54 — immediate resistance area
$8.60 — daily MA(7)
$8.77 — daily MA(25)
Potential support
$8.38–$8.35 — 1H moving-average zone
$8.29 — reported 24-hour low
$7.49 — daily MA(99)
These are chart-based reference levels, not guaranteed support or resistance.
🔍 Three Scenarios to Watch
🟢 Bullish scenario: ETC breaks above $8.54 and moves toward $8.60, with a stronger signal if it can reclaim $8.77.
🟡 Sideways scenario: Price stays around $8.35–$8.54 while the market waits for a clearer direction.
🔴 Bearish scenario: ETC loses the $8.29 area, increasing the risk of a deeper pullback.
🧠 Final View
ETC is showing signs of short-term stabilization, but the daily chart still needs confirmation. The key question is whether buyers can push the price above $8.54 and reclaim the daily moving averages.
Rather than focusing only on a small percentage gain, watch how price reacts around these levels and whether trading volume supports the move.
What is your view on ETC? Will it reclaim $8.77, or will resistance push the price lower? Share your analysis in the comments. 👇
Disclaimer: This article is for educational and informational purposes only, not financial advice. Cryptocurrency markets are volatile. Prices and indicators are based on the supplied Binance screenshots and may change. Verify live market data and do your own research before making trading decisions.
#ETC #EthereumClassic #ETCUSDT #BinanceSquare #CryptoAnalysis #Altcoins #TechnicalAnalysis #CryptoMarket