💰🚀 SOL/USDC Analysis: Are We Nearing a Rebound or Further Downside? 📉
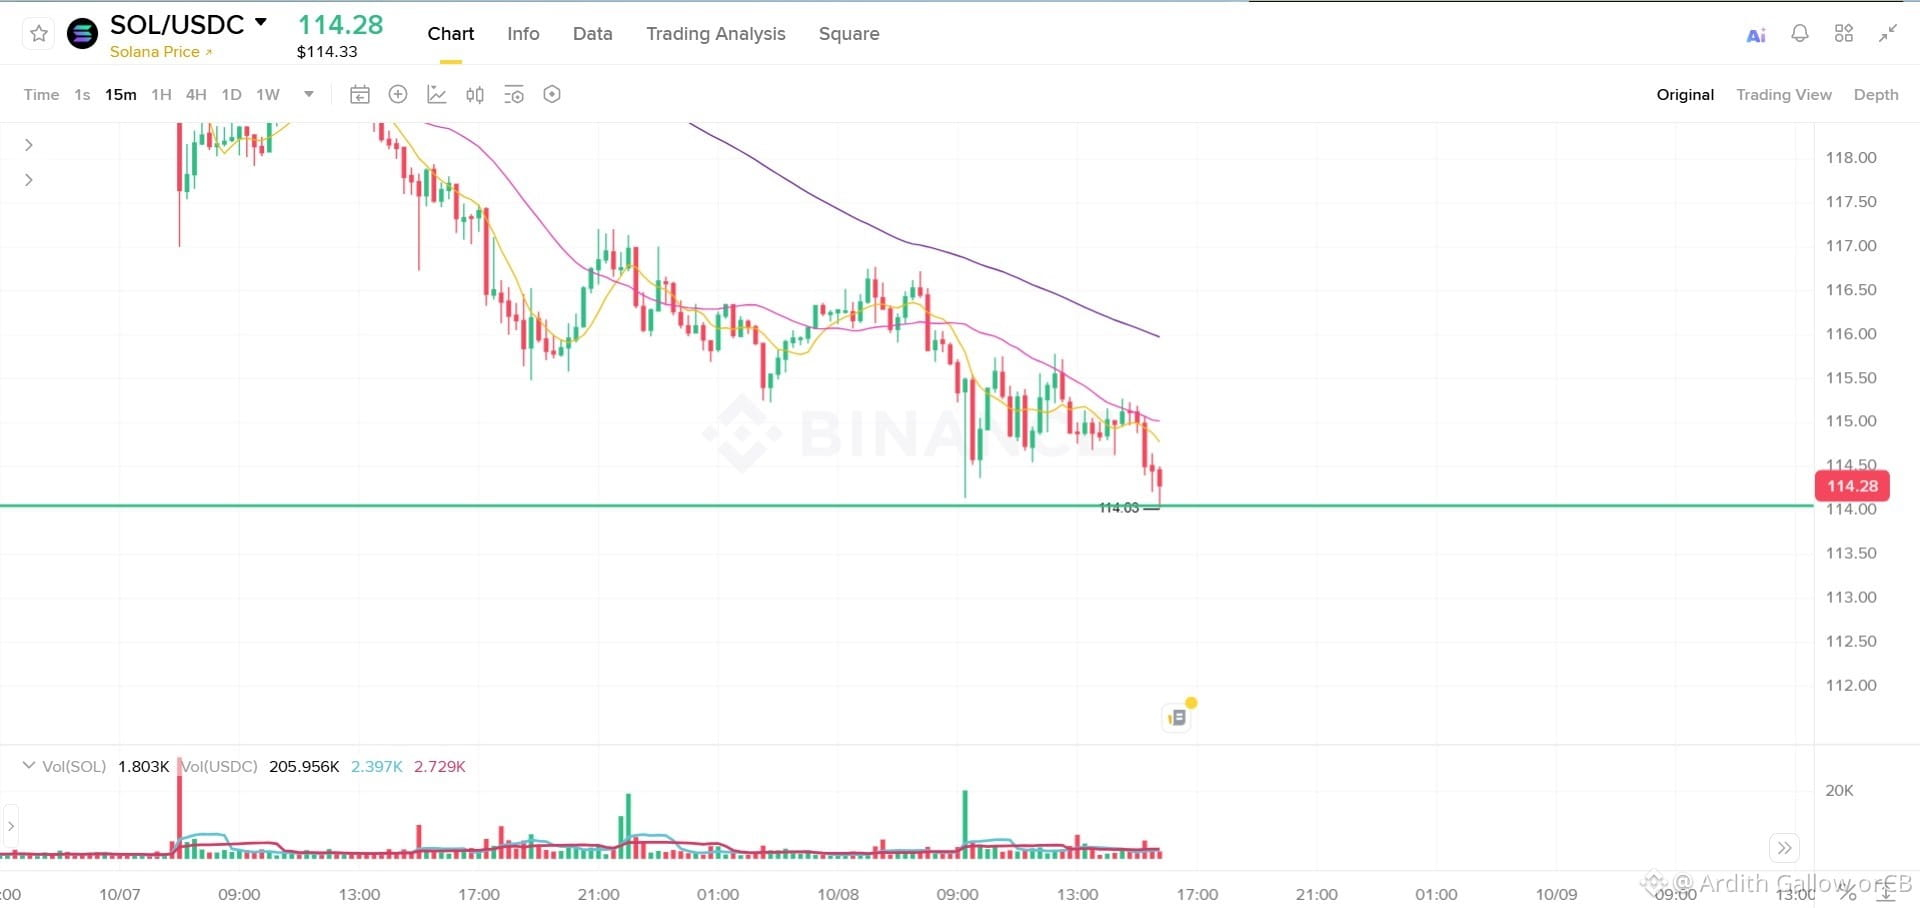
Solana $SOL has taken a clear hit over the last 48 hours, sliding from the $122 resistance area down to test key support near $114.
Here is what the 15 Minute chart is telling us right now:
Trend & Structure: Short-term momentum remains firmly in favor of the bears. Price is holding below all major moving averages—MA(7) at $114.89, MA(25) at $115.91, and MA(99) at $119.32.
Key Levels to Watch:
Immediate Support: $114.00 – $114.15 (Recent wick low). A breakdown below this level could open doors toward lower structural liquidity.
Immediate Resistance: $116.00 (Confluence with 25-MA). Bulls need a clean high-volume close above this area to attempt a reversal.
Volume Profile: The selling pressure was accompanied by large volume spikes during the initial drop, signaling heavy liquidations and spot selling. Current volume is tapering, indicating a potential consolidation/pause.
Game Plan:
Bulls: Look for clear structural confirmation (such as a double bottom or a breakout/retest above $116) before considering long entries.
Bears: A clean breakdown below $114 on volume could signal continuation toward lower support zones.
Remember to manage your risk and stick to strict stop-loss discipline! 🛡️
DYOR | NFA
#CryptoTrading #SOL #Solana #TechnicalAnalysis #BinanceSquare
$SOL
Solana $SOL has taken a clear hit over the last 48 hours, sliding from the $122 resistance area down to test key support near $114.
Here is what the 15 Minute chart is telling us right now:
Trend & Structure: Short-term momentum remains firmly in favor of the bears. Price is holding below all major moving averages—MA(7) at $114.89, MA(25) at $115.91, and MA(99) at $119.32.
Key Levels to Watch:
Immediate Support: $114.00 – $114.15 (Recent wick low). A breakdown below this level could open doors toward lower structural liquidity.
Immediate Resistance: $116.00 (Confluence with 25-MA). Bulls need a clean high-volume close above this area to attempt a reversal.
Volume Profile: The selling pressure was accompanied by large volume spikes during the initial drop, signaling heavy liquidations and spot selling. Current volume is tapering, indicating a potential consolidation/pause.
Game Plan:
Bulls: Look for clear structural confirmation (such as a double bottom or a breakout/retest above $116) before considering long entries.
Bears: A clean breakdown below $114 on volume could signal continuation toward lower support zones.
Remember to manage your risk and stick to strict stop-loss discipline! 🛡️
DYOR | NFA
#CryptoTrading #SOL #Solana #TechnicalAnalysis #BinanceSquare
$SOL