



I opened these charts expecting the usual altcoin damage. Instead, the first thing that jumped out was the speed of the selloff. $LYN had fallen from 0.0308100 to 0.0188800 before finding a bounce, while AIOT was sliding from 0.0596600 toward 0.0463700. The tape was clearly under pressure
Then Bitcoin cracked below $84,000 as liquidations surged. CoinDesk reported roughly $547 million in liquidations as oil prices and macro pressure hit risk assets, with smaller tokens taking heavier losses
But the third chart didn't fit the same script. $SKDD was climbing toward 7.34700 while the first two were bleeding. That's what caught my attention. Three charts, three very different stories
LYN has the clearest leverage warning. Binance funding was around +0.042%, while other major venues were also positive. Longs are paying to stay in while price is falling
Open interest is still meaningful, with Binance around $12.3 million and additional positions spread across other venues. That tells me traders haven't simply walked away. The crowded long side can become fuel for another flush if buyers fail to reclaim resistance
The chart gives me one important reference point at 0.0188800. That's the recent low. Above 0.0227009, the character changes enough for me to start watching the upside again
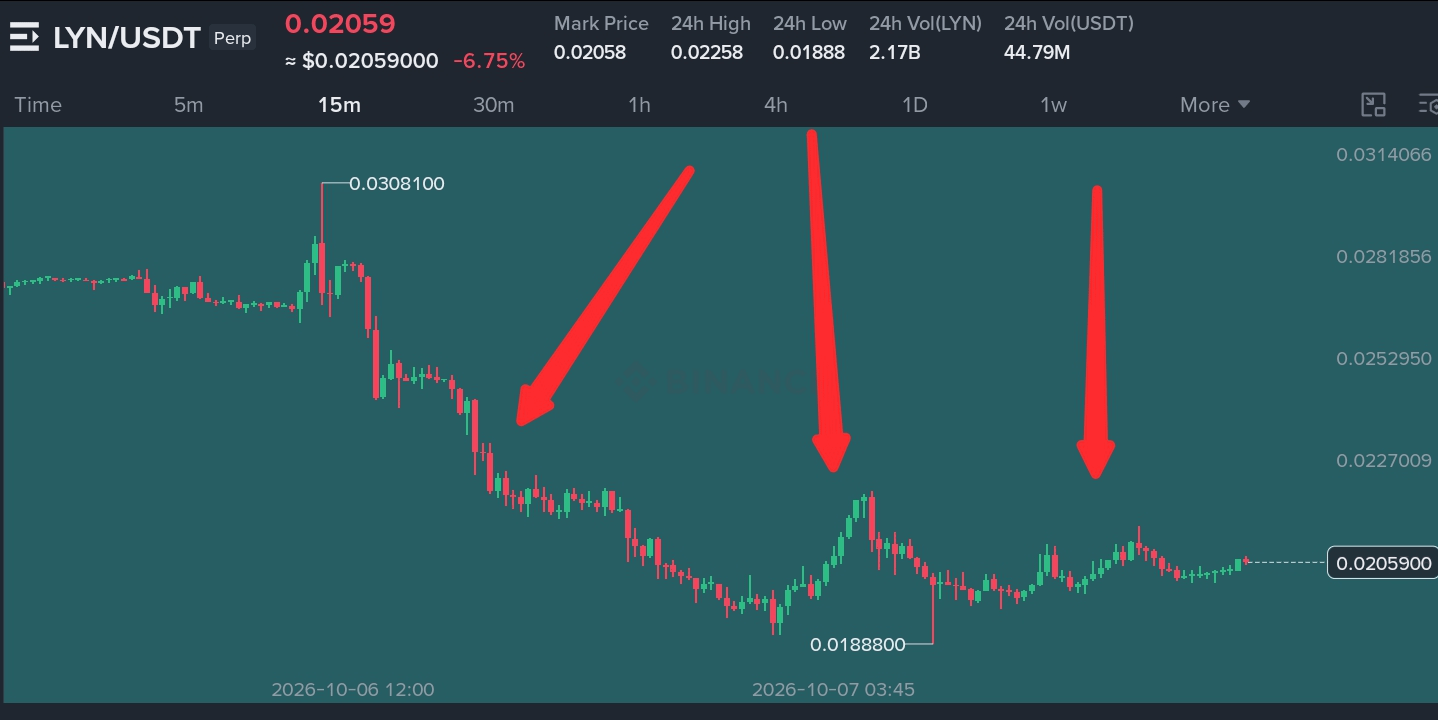
Above 0.02270 and I'm watching 0.02529, then 0.02819. Lose 0.01888 and I'm done


AIOT is also weak, but the derivatives picture is less crowded. Funding is positive around +0.005%, while recent recorded data showed open interest fading about 2.3% over 24 hours. That's usually cleaner than price falling while leverage keeps piling in
The important part is the location. Price reached 0.0463700 and bounced, but the broader chart still has lower highs from the 0.0596600 area. Until buyers reclaim 0.0510715, I don't want to call this a reversal just because a few green candles appeared
There isn't a fresh headline strong enough to override that chart right now. The project still has its utility and infrastructure narrative, but traders are currently pricing the tape more aggressively than the story
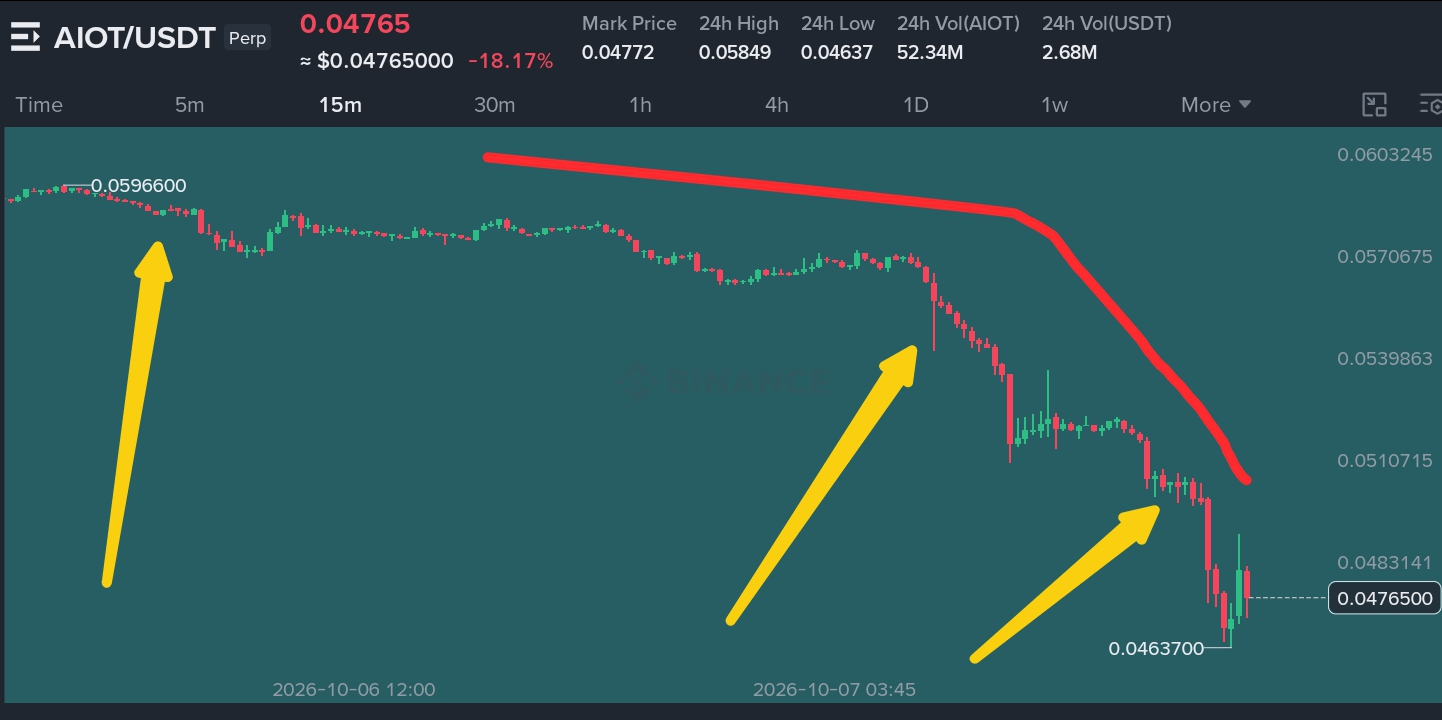
Above 0.05107 and I'm watching 0.05399, then 0.05707. Lose 0.04637 and I'm done

SKDD is the strange one here. It has pushed from 6.25100 toward 7.34700 while the broader crypto market has been under pressure. That's a completely different trade
This isn't a normal crypto asset either. The perpetual tracks the GraniteShares 2x Short SK Hynix Daily ETF, so its behavior is tied to the underlying semiconductor trade. Derivatives data shows open interest has been rising, while funding has recently stayed positive on average
That makes the 7.34700 area important. Buyers have pushed into the recent high, but the higher the price travels, the more important it becomes to see whether fresh demand follows or traders simply chase the move
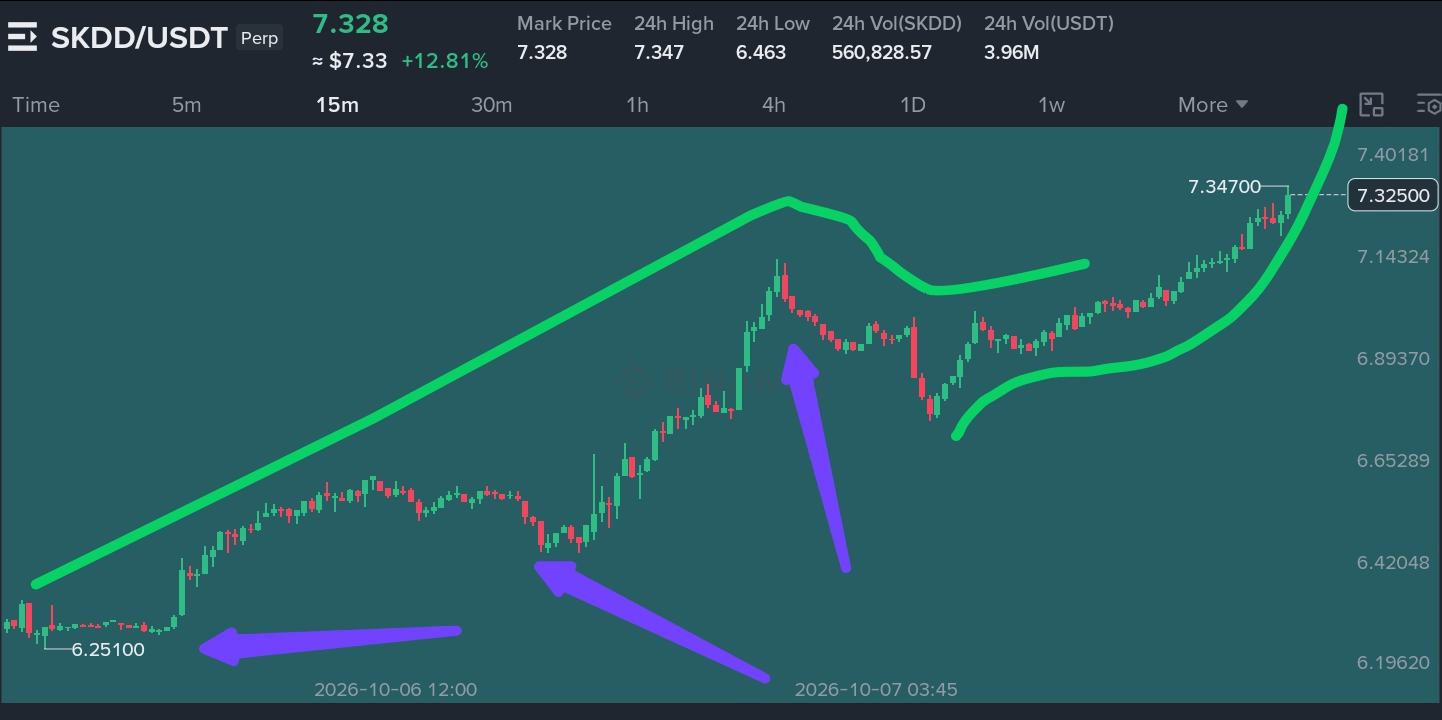
Above 7.143 and I'm watching 7.347, then 7.402. Lose 6.893 and I'm done

Zoom out and the market still looks defensive. Bitcoin fell below $84,000, Ethereum dropped harder, and smaller tokens suffered as leverage was flushed. Bitcoin funding was negative on Binance at roughly -0.0054%, while the five venue average was close to flat
Bitcoin dominance is still close to 59%, which matters here. Capital isn't rotating cleanly into smaller assets while Bitcoin is under pressure. The wider market needs to stabilize before I trust random altcoin bounces
I've made the mistake before of buying the first green candle after a violent flush because the price looked cheap. Cheap wasn't the signal. Reclaiming a level was
Right now, LYN needs to reclaim resistance, $AIOT needs to defend its fresh low, and SKDD needs to prove its strength can survive a reversal in the underlying market
Which of these three charts would you trust with real money first?