$BTC: When the Chart Snoozes, My Brain Hits the Gym
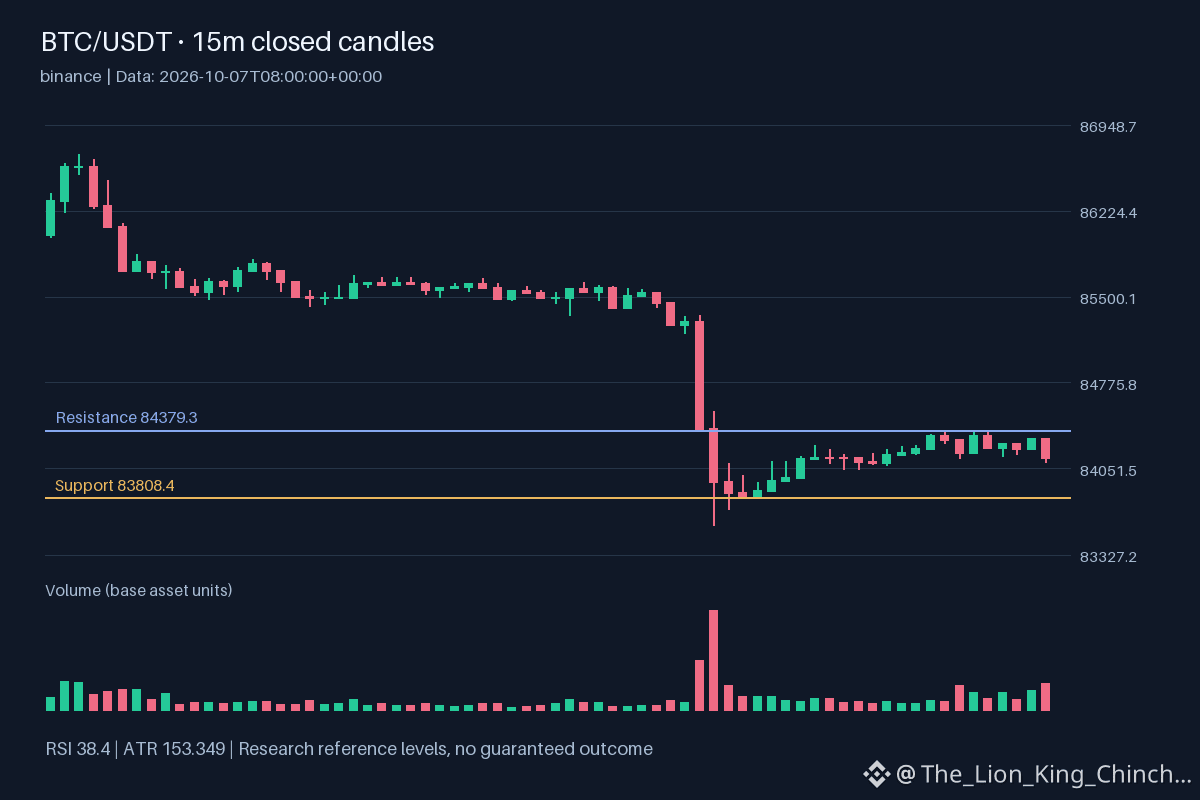
I once set a timer to stare at the BTC chart for exactly five minutes, then brag about my "quick decision" on a forum. The timer buzzed, the price was still hovering near 83808.4, and my brain had already drafted a heroic entry story. The joke is that the watchlist felt calm while my imagination sprinted.
Why does this happen? The hourly direction is down and volume sits above baseline, a classic sign that traders are watching the dip but not committing. Higher 2.31997 often fuels the illusion of a hidden surge, making us over‑estimate momentum. Our minds fill the gap with narrative, assuming the next candle will flip the trend.
A useful habit to break the trap: pause and check a single, concrete metric before reacting. For example, compare the current 85234.2 to the recent 84307.9. If the VWAP still sits below the EMA, the downtrend retains its edge despite noisy volume. Write down the observation, wait an extra hour, and then reassess. This simple step replaces a knee‑jerk impulse with a measured view, keeping the research habit disciplined and the portfolio calmer. 😊
Probabilistic market research, not a recommendation or guaranteed return.
Which research habit has saved you from an impulsive click?
#BTC #LearnCrypto #CryptoLearning
I once set a timer to stare at the BTC chart for exactly five minutes, then brag about my "quick decision" on a forum. The timer buzzed, the price was still hovering near 83808.4, and my brain had already drafted a heroic entry story. The joke is that the watchlist felt calm while my imagination sprinted.
Why does this happen? The hourly direction is down and volume sits above baseline, a classic sign that traders are watching the dip but not committing. Higher 2.31997 often fuels the illusion of a hidden surge, making us over‑estimate momentum. Our minds fill the gap with narrative, assuming the next candle will flip the trend.
A useful habit to break the trap: pause and check a single, concrete metric before reacting. For example, compare the current 85234.2 to the recent 84307.9. If the VWAP still sits below the EMA, the downtrend retains its edge despite noisy volume. Write down the observation, wait an extra hour, and then reassess. This simple step replaces a knee‑jerk impulse with a measured view, keeping the research habit disciplined and the portfolio calmer. 😊
Probabilistic market research, not a recommendation or guaranteed return.
Which research habit has saved you from an impulsive click?
#BTC #LearnCrypto #CryptoLearning