RSI hitting 30 isn't an automatic buy signal, despite what many beginners think. ⚡
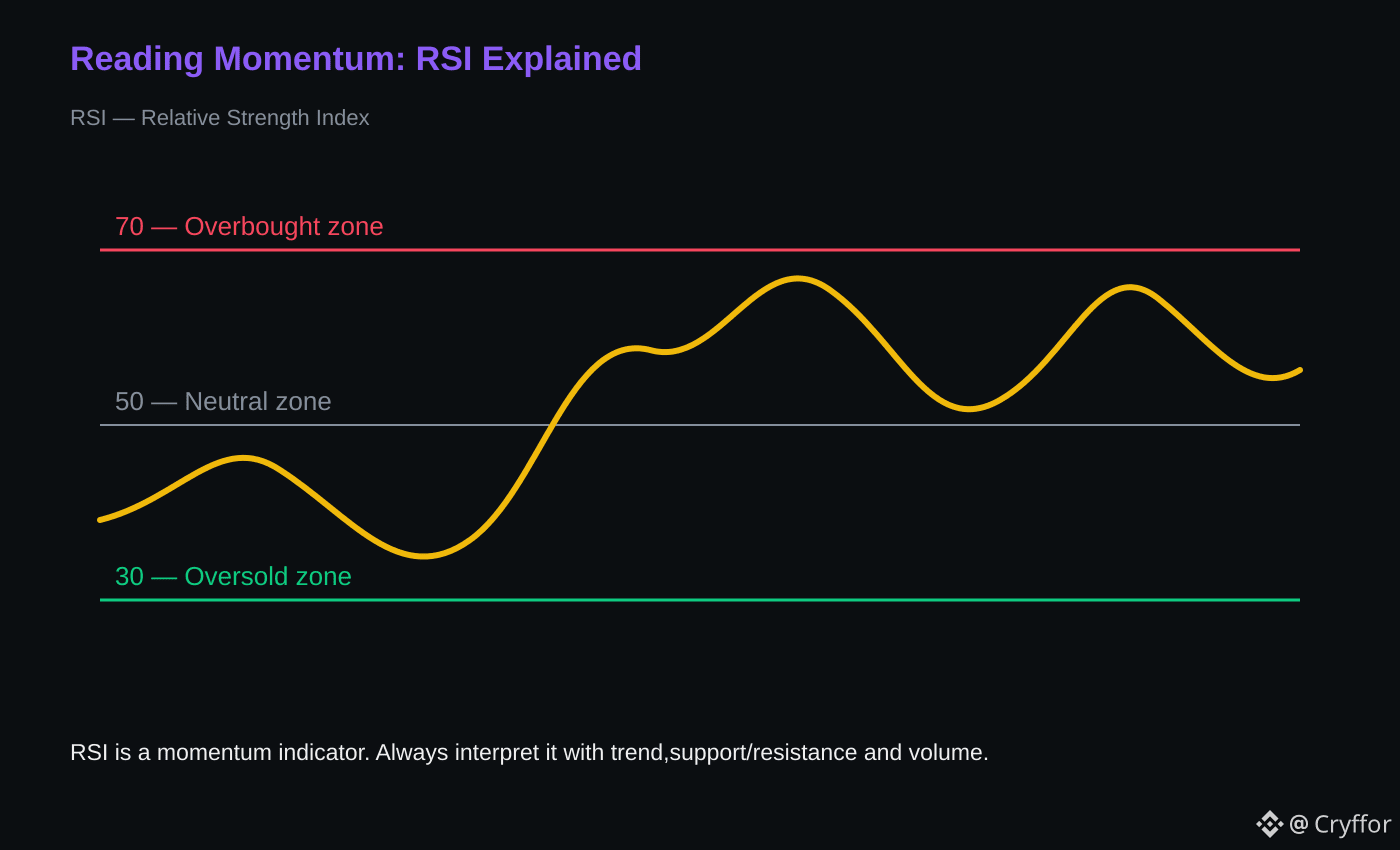
The Relative Strength Index (RSI) measures momentum on a 0–100 scale. Understanding its key levels is straightforward:
• Above 70: Typically signals strong or potentially overextended momentum.
• Around 50: Signals balanced momentum.
• Below 30: Typically signals weak or potentially oversold momentum.
Here is the key catch: RSI should never be used alone. Relying on this indicator by itself often leads to false signals. To get reliable confirmation before making a move, you must combine RSI with price structure, volume, and trend. 🎯
Do you combine RSI with price structure and volume, or rely on it alone? 💡
#CryptoTrading #TechnicalAnalysis #TradingTips #BinanceSquare
The Relative Strength Index (RSI) measures momentum on a 0–100 scale. Understanding its key levels is straightforward:
• Above 70: Typically signals strong or potentially overextended momentum.
• Around 50: Signals balanced momentum.
• Below 30: Typically signals weak or potentially oversold momentum.
Here is the key catch: RSI should never be used alone. Relying on this indicator by itself often leads to false signals. To get reliable confirmation before making a move, you must combine RSI with price structure, volume, and trend. 🎯
Do you combine RSI with price structure and volume, or rely on it alone? 💡
#CryptoTrading #TechnicalAnalysis #TradingTips #BinanceSquare