$NIL: Assessing NIL Stability Against Peers
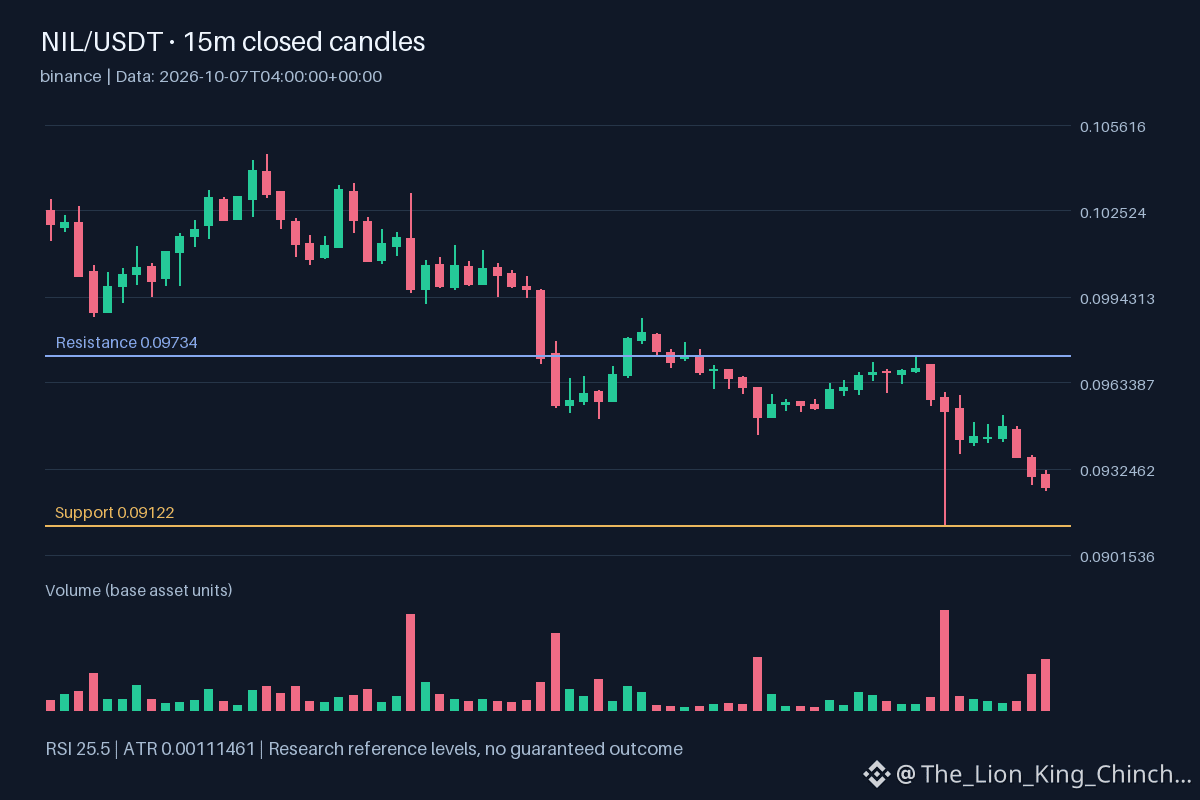
When analyzing market structures, traders often choose between following an index leader or prioritizing individual asset resilience. Currently, $NIL demonstrates a hourly direction of down, yet maintains volume above baseline. This distinguishes the asset from peers like $ETH and $MAGIC , which both exhibit a hourly direction of down but show volume not above its baseline. This disparity invites a closer examination of how individual price action behaves when broader market interest wanes. Understanding these variations requires recognizing that a shared hourly direction is not measured correlation or sector membership. The observed hourly difference highlights the limit of local market context. While $NIL maintains distinct volume, the behavior of $ETH and $MAGIC serves as a useful benchmark for typical market sentiment. A thought experiment here involves considering whether $NIL holds its structure because of unique buyers or simply a lag in seller participation. To reassess this interpretation, monitor if the volume remains above baseline while price interacts with support 0.09122 or resistance 0.09734. If the volume drops while the hourly direction remains stagnant, the perceived resilience may lack foundational strength. Relying solely on these metrics without observing the interaction with the 0.0951273 and 0.0969309 can lead to incomplete conclusions regarding structural health. Assessing these nuances provides a more precise way to navigate volatility than focusing on relative change -0.430015 alone. 📉
Probabilistic market research, not a recommendation or guaranteed return.
For a wider view: $ETH has hourly direction down and volume not above its baseline; $MAGIC has hourly direction down and volume not above its baseline. This alone does not establish correlation.
Would you focus on the leader or the asset holding its structure?
#NIL #ETH #MAGIC #CryptoWatchlist #CryptoLearning
When analyzing market structures, traders often choose between following an index leader or prioritizing individual asset resilience. Currently, $NIL demonstrates a hourly direction of down, yet maintains volume above baseline. This distinguishes the asset from peers like $ETH and $MAGIC , which both exhibit a hourly direction of down but show volume not above its baseline. This disparity invites a closer examination of how individual price action behaves when broader market interest wanes. Understanding these variations requires recognizing that a shared hourly direction is not measured correlation or sector membership. The observed hourly difference highlights the limit of local market context. While $NIL maintains distinct volume, the behavior of $ETH and $MAGIC serves as a useful benchmark for typical market sentiment. A thought experiment here involves considering whether $NIL holds its structure because of unique buyers or simply a lag in seller participation. To reassess this interpretation, monitor if the volume remains above baseline while price interacts with support 0.09122 or resistance 0.09734. If the volume drops while the hourly direction remains stagnant, the perceived resilience may lack foundational strength. Relying solely on these metrics without observing the interaction with the 0.0951273 and 0.0969309 can lead to incomplete conclusions regarding structural health. Assessing these nuances provides a more precise way to navigate volatility than focusing on relative change -0.430015 alone. 📉
Probabilistic market research, not a recommendation or guaranteed return.
For a wider view: $ETH has hourly direction down and volume not above its baseline; $MAGIC has hourly direction down and volume not above its baseline. This alone does not establish correlation.
Would you focus on the leader or the asset holding its structure?
#NIL #ETH #MAGIC #CryptoWatchlist #CryptoLearning