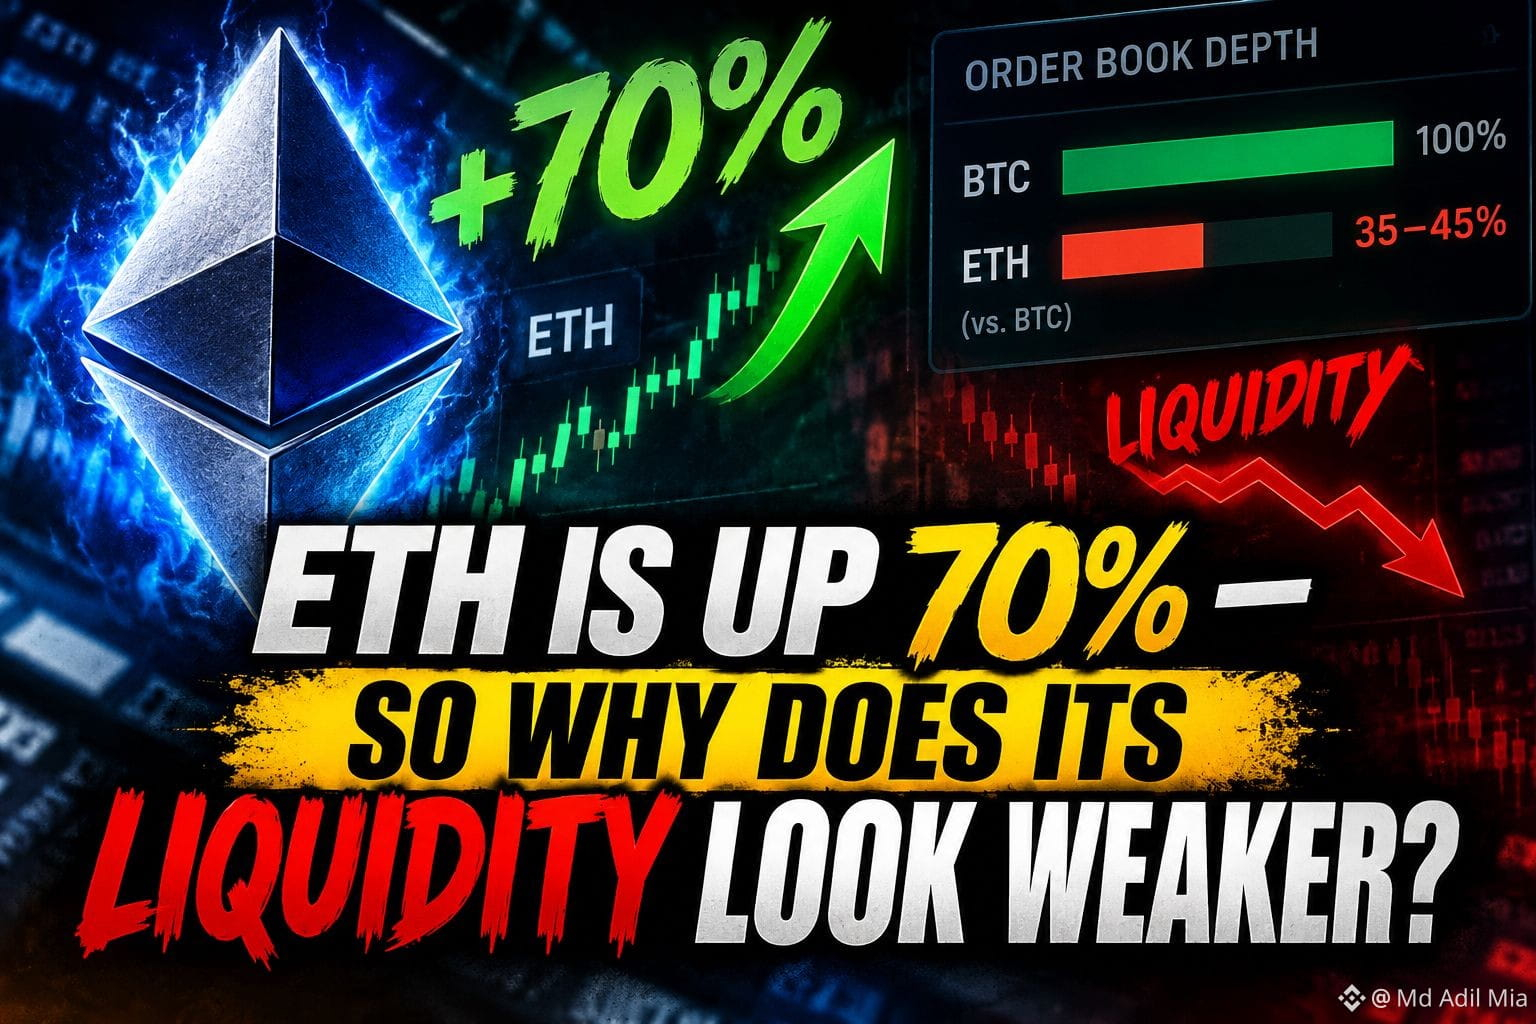
🚨 ETH IS UP 70% — SO WHY DOES ITS LIQUIDITY LOOK WEAKER?
At first glance, that sounds bearish.
But the data tells a more interesting story. 👀
📈 ETH gained ~70% in Q3, outperforming BTC’s ~42% rise.
Yet ETH’s median daily order-book depth was only around 35–45% of BTC’s, down from at least 60% a year earlier.
But here’s the key point:
💧 ETH still had roughly $13–14M of liquidity within ±0.15% of its market price.
So ETH didn’t necessarily become illiquid.
👉 BTC simply became much deeper.
BTC’s comparable depth reached around $29M on bids and $37M on asks, supported by a major increase in liquidity.
Meanwhile, ETH attracted roughly $3.1B in spot ETF inflows during Q3.
But much of that capital doesn’t directly sit inside the CEX order books being measured.
That creates an interesting setup:
⚡ Strong capital inflows
⚡ Powerful price momentum
⚠️ Relatively thinner exchange liquidity
And that means large orders can push ETH faster in either direction.
🧠 SQUARE INSIGHT
A thinner order book doesn’t tell you whether ETH will go up or down.
It tells you that the next big move could be amplified.
So what matters more for ETH from here?
💰 Fresh capital inflows
or
💧 Deeper market liquidity?
What’s your take? 👇
#ETH #Ethereum #crypto #BinanceSquare #BTC
At first glance, that sounds bearish.
But the data tells a more interesting story. 👀
📈 ETH gained ~70% in Q3, outperforming BTC’s ~42% rise.
Yet ETH’s median daily order-book depth was only around 35–45% of BTC’s, down from at least 60% a year earlier.
But here’s the key point:
💧 ETH still had roughly $13–14M of liquidity within ±0.15% of its market price.
So ETH didn’t necessarily become illiquid.
👉 BTC simply became much deeper.
BTC’s comparable depth reached around $29M on bids and $37M on asks, supported by a major increase in liquidity.
Meanwhile, ETH attracted roughly $3.1B in spot ETF inflows during Q3.
But much of that capital doesn’t directly sit inside the CEX order books being measured.
That creates an interesting setup:
⚡ Strong capital inflows
⚡ Powerful price momentum
⚠️ Relatively thinner exchange liquidity
And that means large orders can push ETH faster in either direction.
🧠 SQUARE INSIGHT
A thinner order book doesn’t tell you whether ETH will go up or down.
It tells you that the next big move could be amplified.
So what matters more for ETH from here?
💰 Fresh capital inflows
or
💧 Deeper market liquidity?
What’s your take? 👇
#ETH #Ethereum #crypto #BinanceSquare #BTC