Is this massive surge for RLCUSDT about to clear its final hurdle, or are we on the verge of a sharp reset?
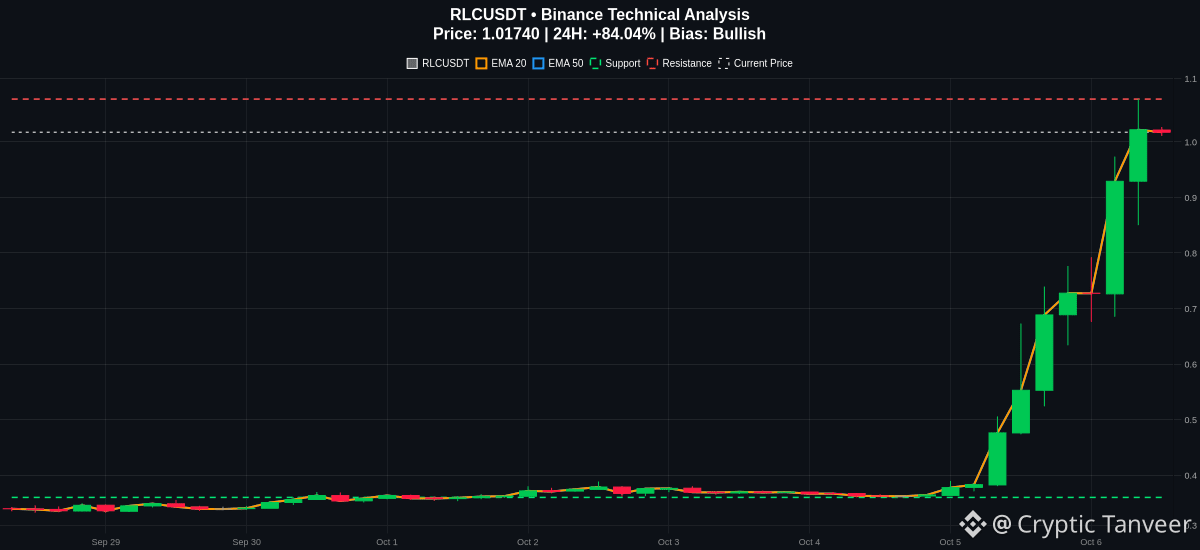
The charts are showing intense momentum as the price sits at 1.0174, logging an 84 percent gain over the past 24 hours. The structure remains heavily bullish with the price trading far above the EMA20 at 0.611 and the EMA50 at 0.476, while the MACD reflects strong positive momentum at 0.148 above the signal line.
Price is now pressing directly against immediate resistance at 1.077.
At the same time, the RSI is sitting at an extremely elevated 97.16. While this level highlights intense buying pressure, it also signals high overextension risk and the possibility of a mean reversion pullback away from the EMA20.
A daily close breaking and holding past the 1.077 resistance could open the door for continuation. However, any failure here puts key support down at 0.36 in focus for a potential retest. Manage your risk closely and watch how price reacts at this barrier.
Where do you expect RLCUSDT to close its daily candle?
#RLC #CryptoTrading #TechnicalAnalysis
The charts are showing intense momentum as the price sits at 1.0174, logging an 84 percent gain over the past 24 hours. The structure remains heavily bullish with the price trading far above the EMA20 at 0.611 and the EMA50 at 0.476, while the MACD reflects strong positive momentum at 0.148 above the signal line.
Price is now pressing directly against immediate resistance at 1.077.
At the same time, the RSI is sitting at an extremely elevated 97.16. While this level highlights intense buying pressure, it also signals high overextension risk and the possibility of a mean reversion pullback away from the EMA20.
A daily close breaking and holding past the 1.077 resistance could open the door for continuation. However, any failure here puts key support down at 0.36 in focus for a potential retest. Manage your risk closely and watch how price reacts at this barrier.
Where do you expect RLCUSDT to close its daily candle?
#RLC #CryptoTrading #TechnicalAnalysis