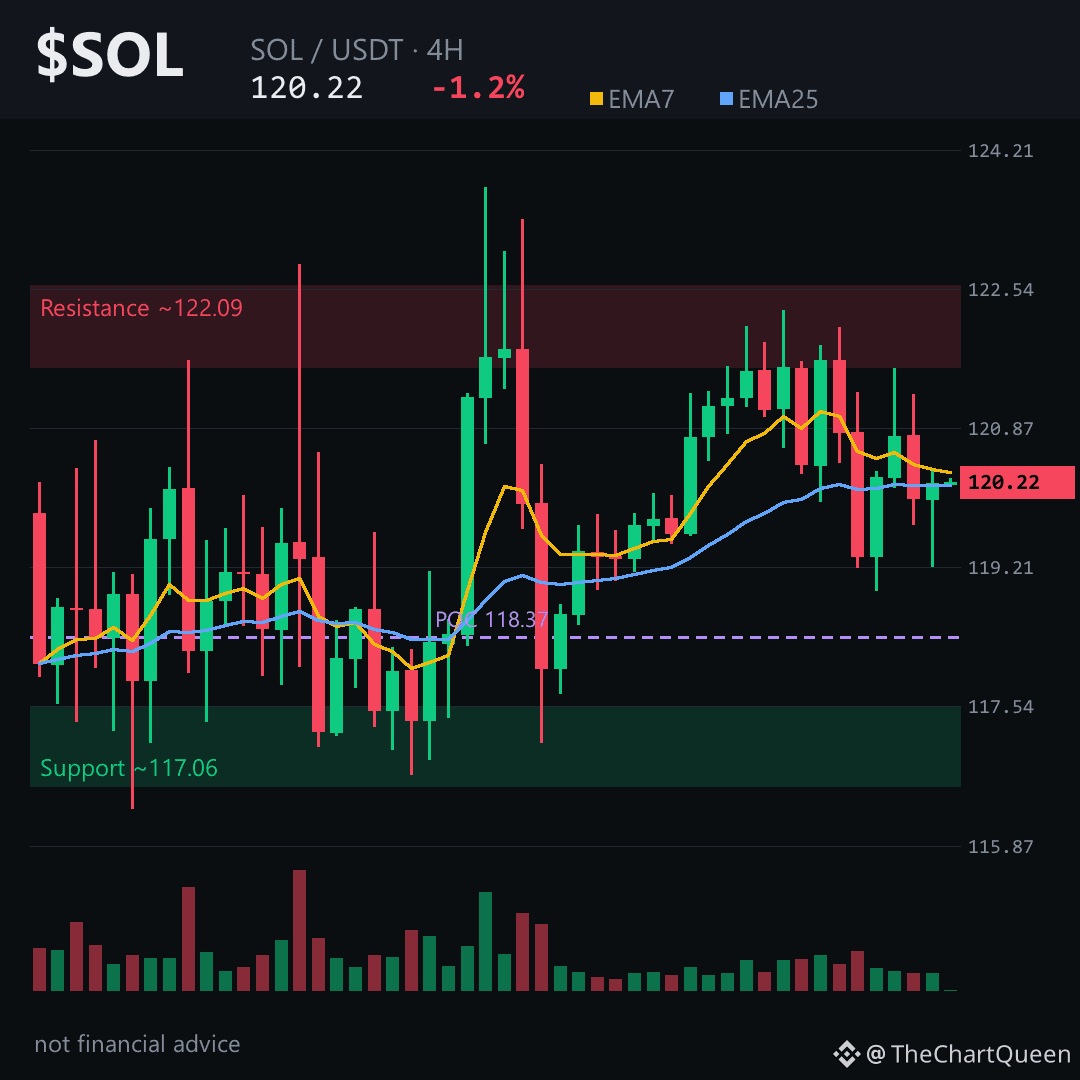
Imagine sitting at a coffee shop, watching a coin trade in a 3-dollar range for six hours straight — that’s $SOL right now, and the quiet is telling a louder story than any pump could.
Price is hovering around 120, but the daily chart holds a bullish gap from roughly 111 to 115 that never got filled. The 4-hour shows the 7-period average just above the 25-period — momentum is technically positive, but only by cents. RSI near 50: no one’s in control.
Funding is slightly negative — shorts paying longs — while the long/short ratio sits above 1. Conviction is thin. A squeeze either way wouldn’t need much fuel.
The line that matters most is 118. That’s the last 24 hours’ support, aligned with the gap’s upper edge. If $SOL loses the 117–118 zone on a solid 4-hour close, the gap becomes the next destination. A push back above 122 opens the path toward 125 — the last local high.
This is a coiled market waiting for a catalyst. Daily trend favors upside, but 4-hour exhaustion near 122 is real. Lose 117, and the picture changes fast.
Tap $SOL to pull up the chart and see how these levels line up yourself.
Which zone are you trusting more right now — the 118 floor or the 125 ceiling? 👇
Not financial advice. DYOR.
Follow for the next read on this chart.
#SOL #Solana #Crypto #BinanceSquare
Price is hovering around 120, but the daily chart holds a bullish gap from roughly 111 to 115 that never got filled. The 4-hour shows the 7-period average just above the 25-period — momentum is technically positive, but only by cents. RSI near 50: no one’s in control.
Funding is slightly negative — shorts paying longs — while the long/short ratio sits above 1. Conviction is thin. A squeeze either way wouldn’t need much fuel.
The line that matters most is 118. That’s the last 24 hours’ support, aligned with the gap’s upper edge. If $SOL loses the 117–118 zone on a solid 4-hour close, the gap becomes the next destination. A push back above 122 opens the path toward 125 — the last local high.
This is a coiled market waiting for a catalyst. Daily trend favors upside, but 4-hour exhaustion near 122 is real. Lose 117, and the picture changes fast.
Tap $SOL to pull up the chart and see how these levels line up yourself.
Which zone are you trusting more right now — the 118 floor or the 125 ceiling? 👇
Not financial advice. DYOR.
Follow for the next read on this chart.
#SOL #Solana #Crypto #BinanceSquare