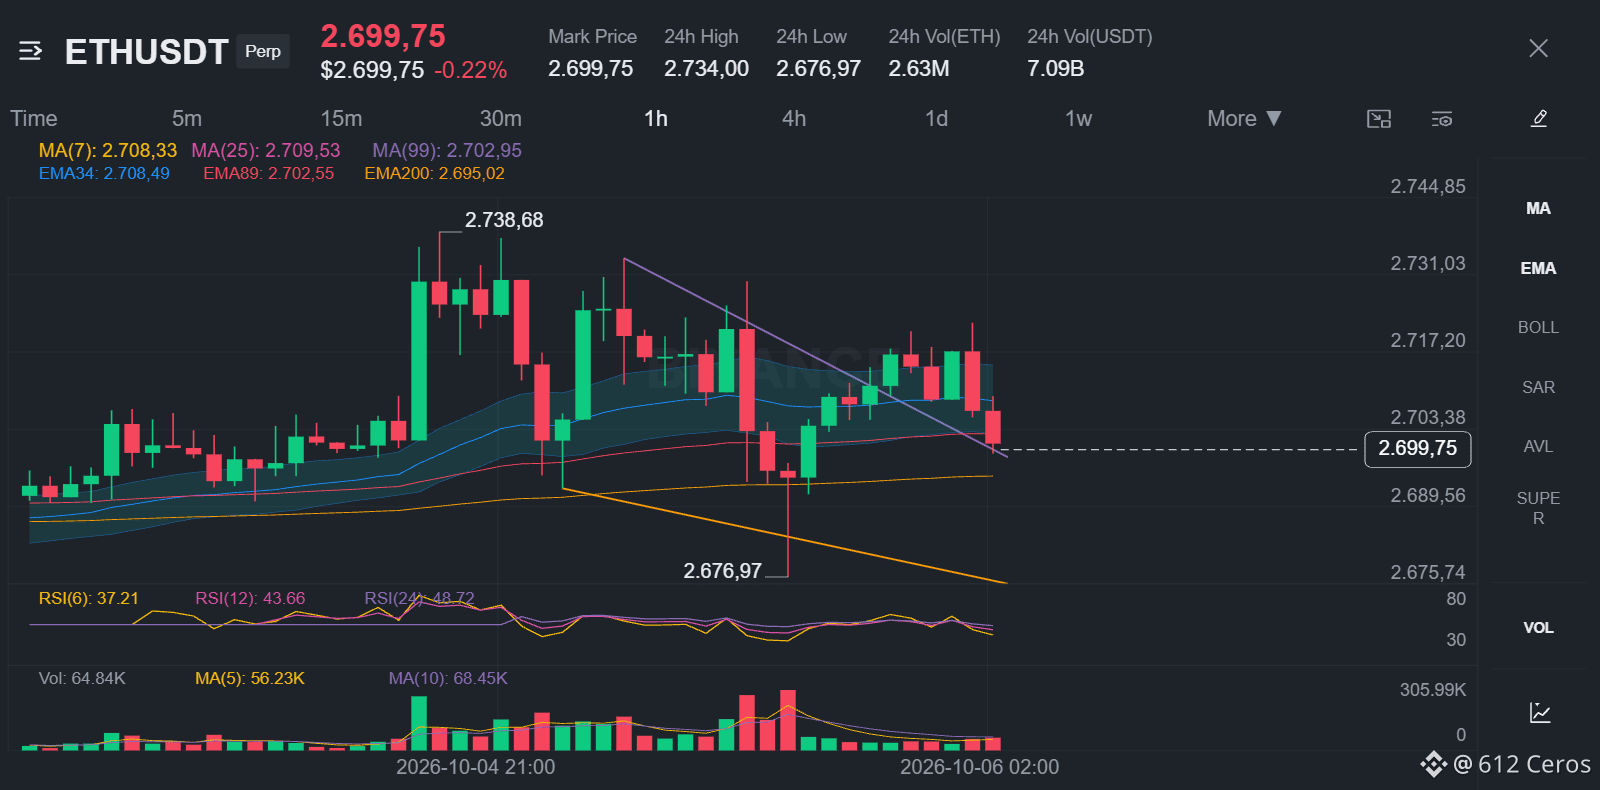
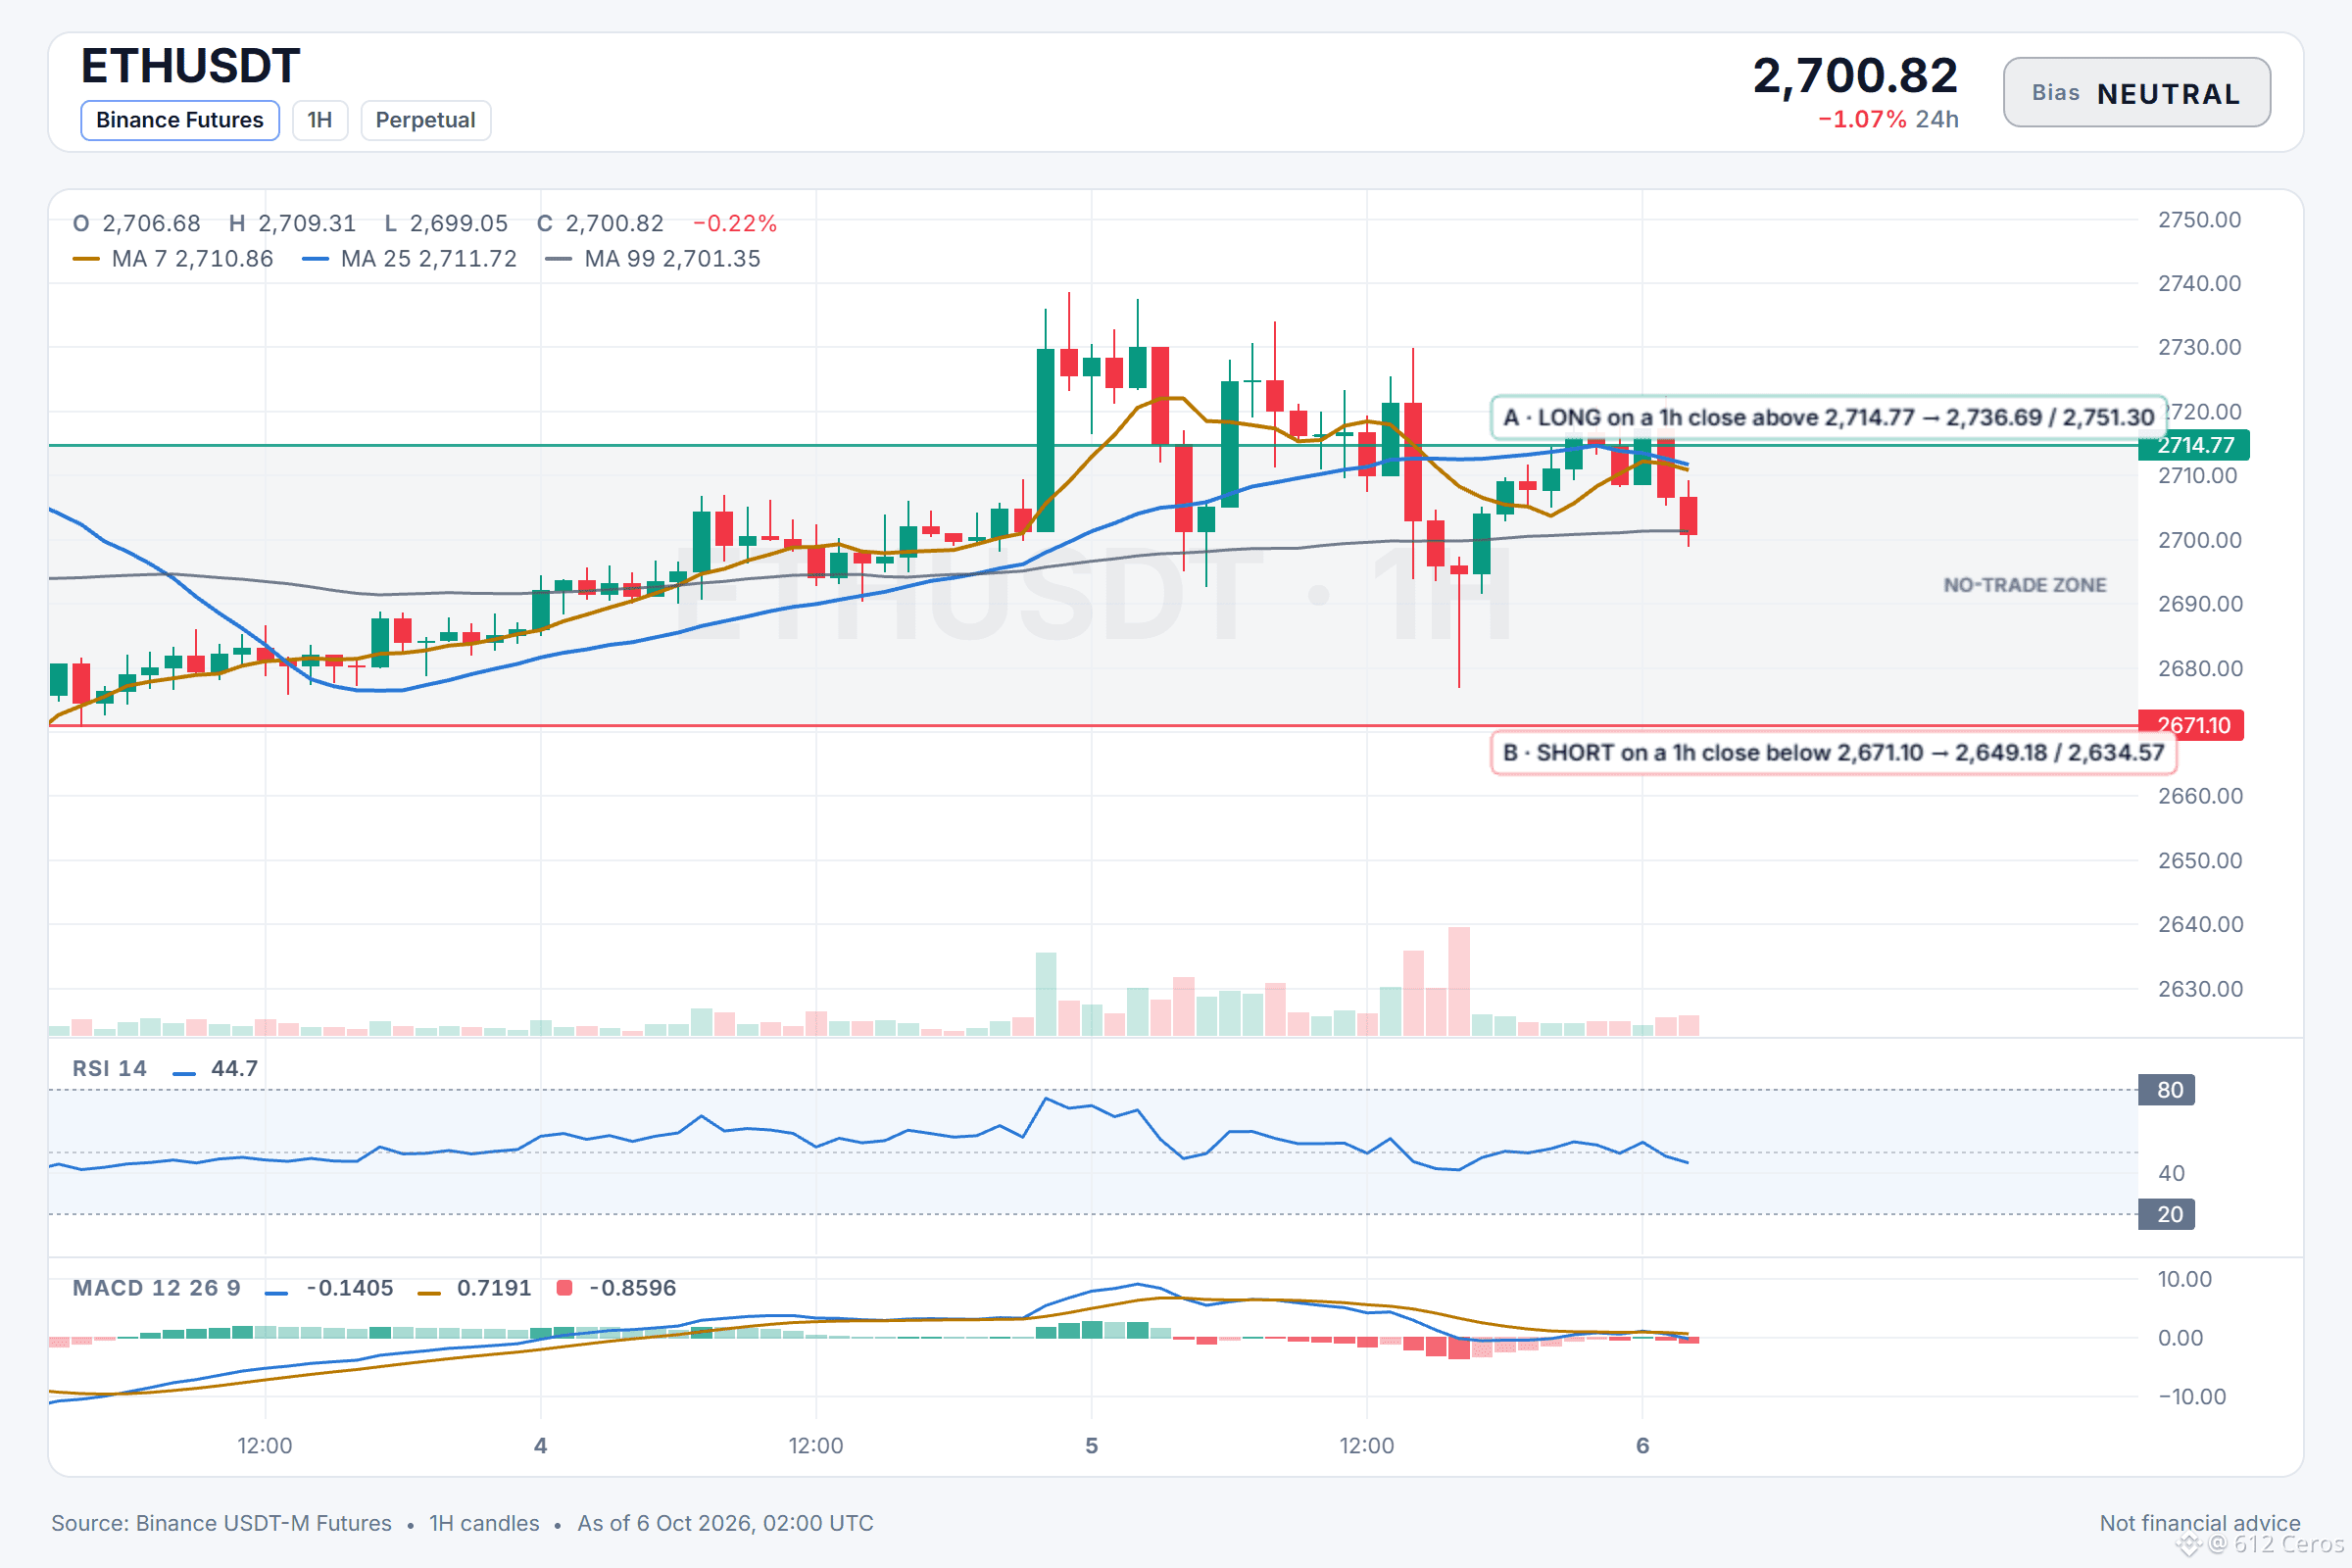
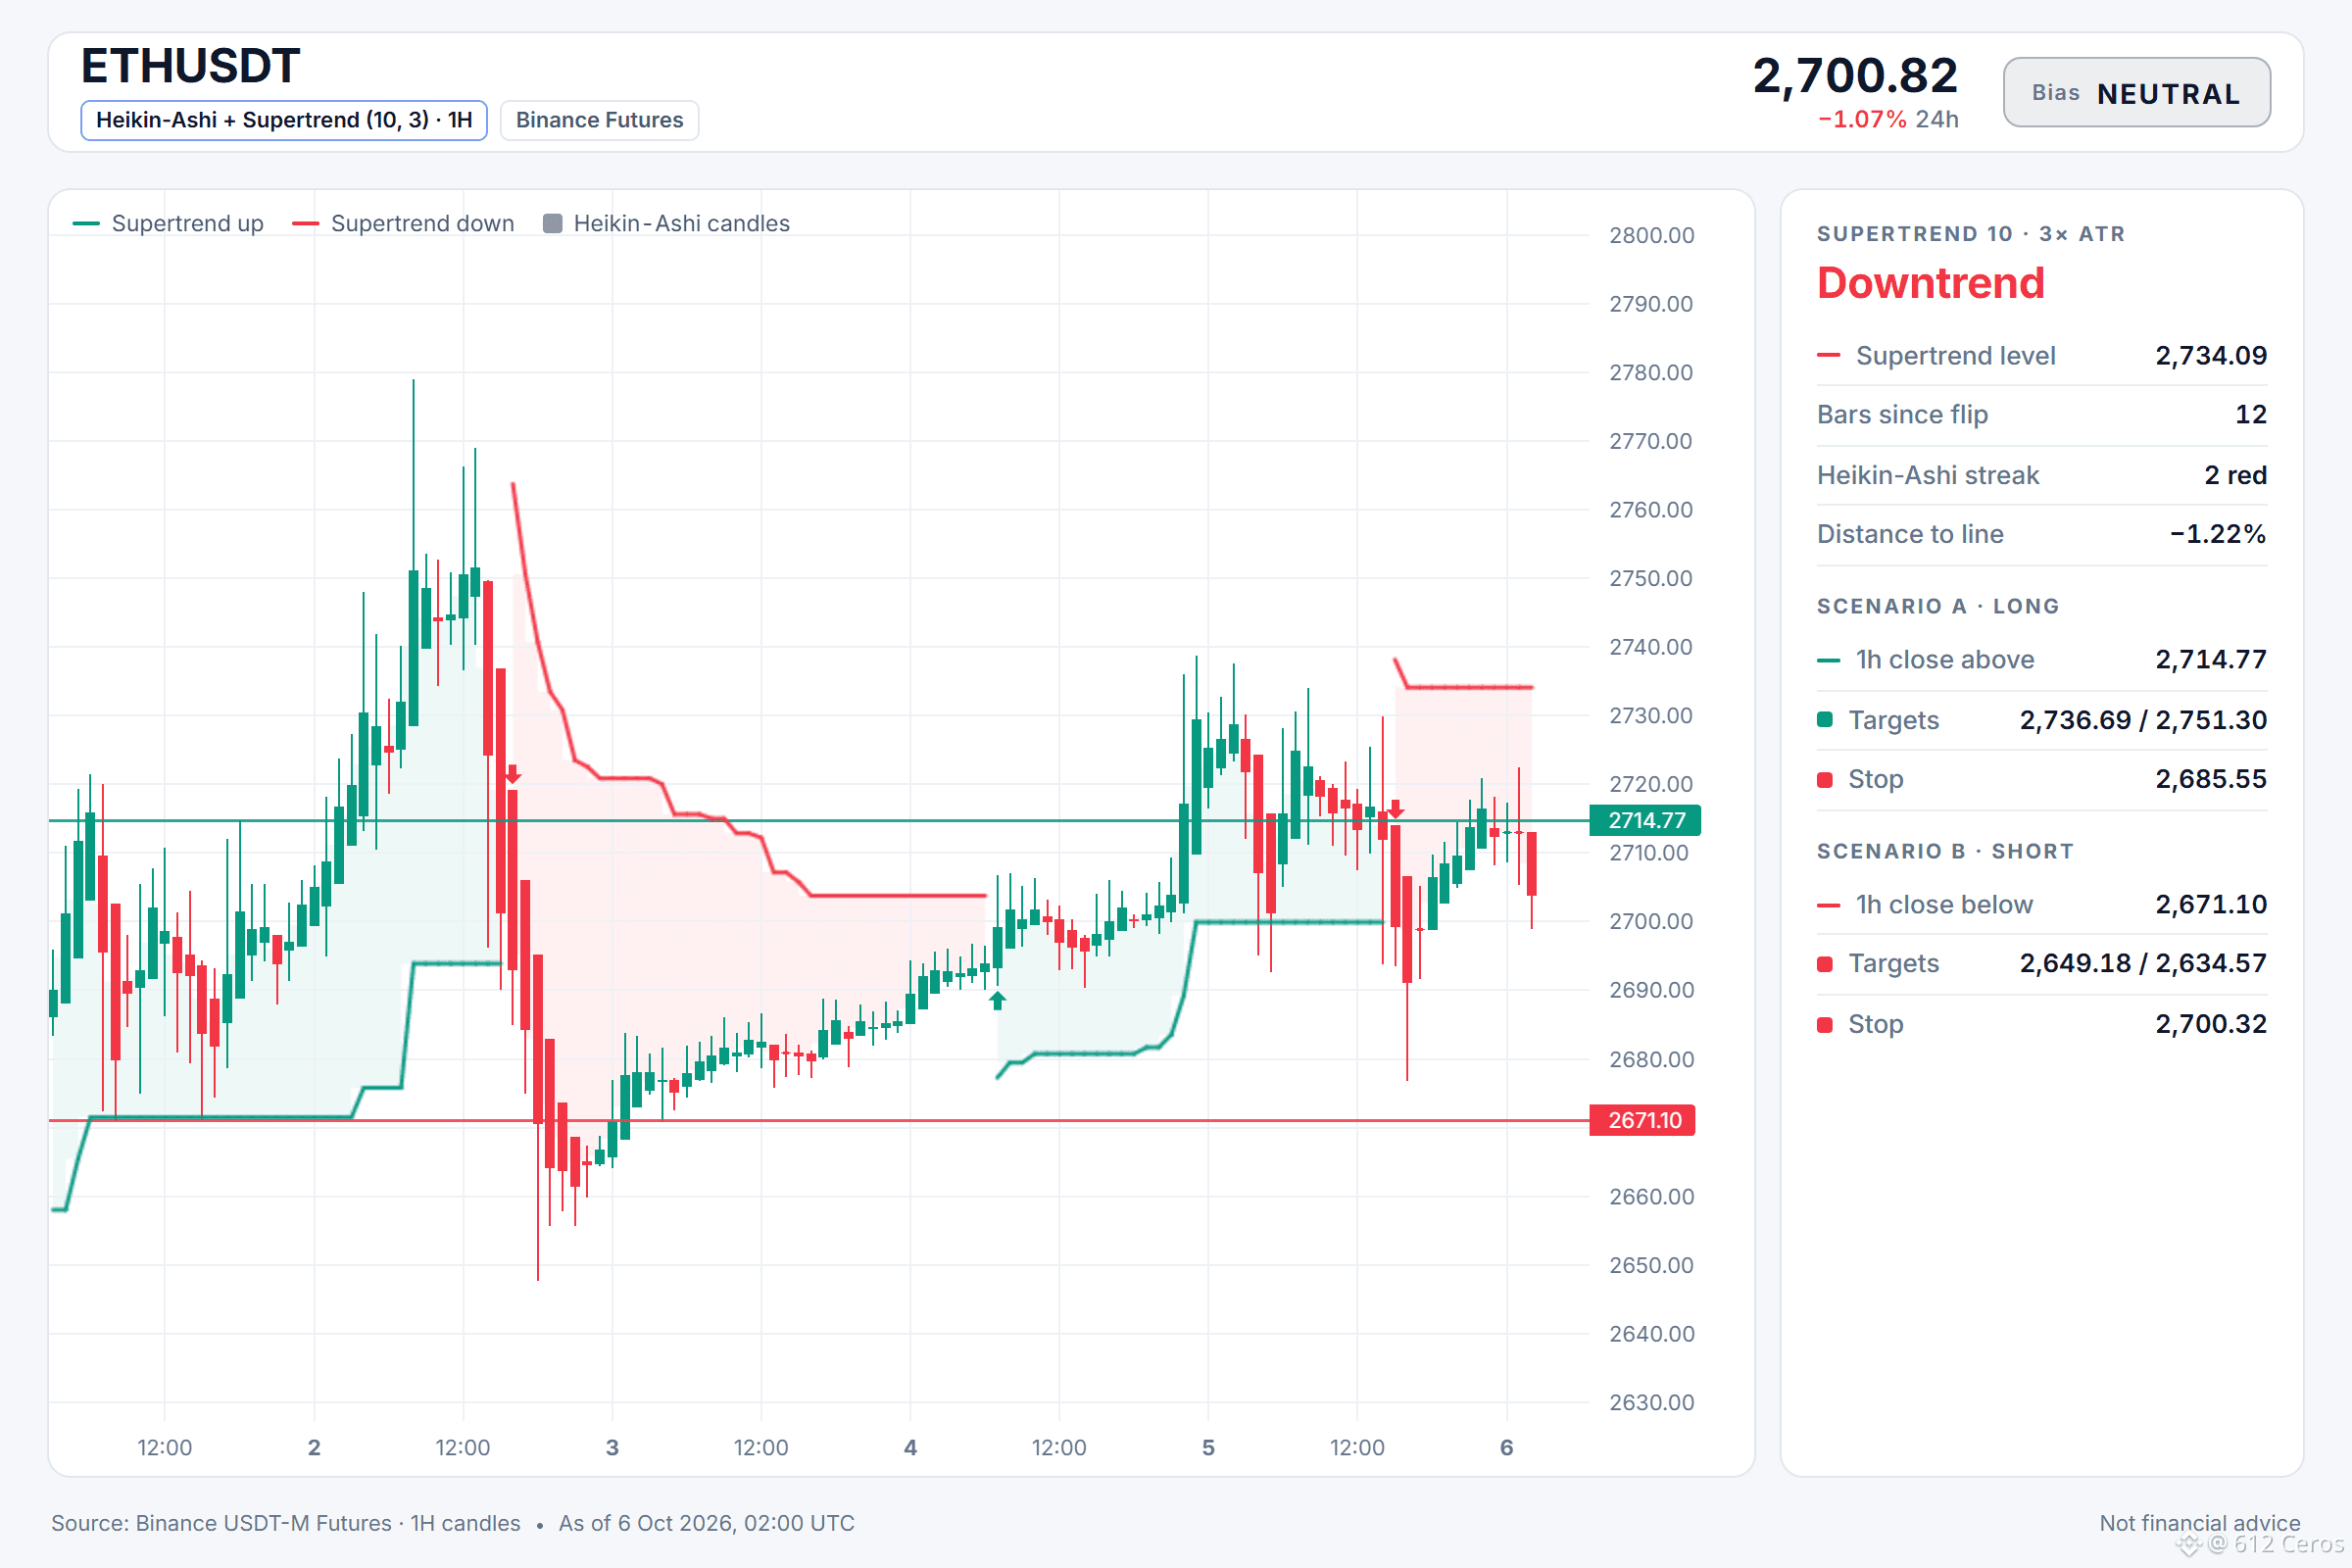
ETH is coiled between 2671.10 and 2714.77: no trade until one side breaks
$ETH /USDT: NO TRADE YET, waiting for one side to break
Bias: NEUTRAL · 2 bullish vs 3 bearish
What would make me act:
LONG on a 1h close above 2714.77 → targets 2736.69 / 2751.30 / 2773.21, stop 2685.55
SHORT on a 1h close below 2671.10 → targets 2649.18 / 2634.57 / 2612.66, stop 2700.32
In between (1.6% wide): no edge, no trade.
Technical read: NEUTRAL. 2 of 12 signals bullish, 3 bearish, 7 undecided.
What leans up:
• Daily trend: price > EMA50 > EMA200, bullish stack → the big-picture trend is up
• 4h trend: price > EMA50 > EMA200, bullish stack → the swing trend is up
What leans down:
• BTC backdrop: BTC trend is bearish and correlation is 0.88 → BTC is falling and this coin tends to follow
• 1h RSI: 44.7, bearish momentum (below 45) → sellers have the momentum
What would tip it:
Signals are split 2 bullish against 3 bearish, so there is no edge worth paying for yet. A 1h close above 2714.77 would hand control to buyers and activate the long scenario; a 1h close below 2671.10 would do the same for sellers. Until one of those prints, the range is noise.
Which side of ETH breaks first, 2714.77 or 2671.10?
Levels mapped on the chart below.
📲 Want more of my latest signals? Join me here:
https://app.binance.com/uni-qr/D26WbL9t
⚠️ Personal market analysis only. NFA — manage risk and DYOR.
Educational content, not investment advice or a recommendation to buy, sell, deposit, or withdraw any asset. No paid promotion or referral/affiliate links.
$ETH /USDT: NO TRADE YET, waiting for one side to break
Bias: NEUTRAL · 2 bullish vs 3 bearish
What would make me act:
LONG on a 1h close above 2714.77 → targets 2736.69 / 2751.30 / 2773.21, stop 2685.55
SHORT on a 1h close below 2671.10 → targets 2649.18 / 2634.57 / 2612.66, stop 2700.32
In between (1.6% wide): no edge, no trade.
Technical read: NEUTRAL. 2 of 12 signals bullish, 3 bearish, 7 undecided.
What leans up:
• Daily trend: price > EMA50 > EMA200, bullish stack → the big-picture trend is up
• 4h trend: price > EMA50 > EMA200, bullish stack → the swing trend is up
What leans down:
• BTC backdrop: BTC trend is bearish and correlation is 0.88 → BTC is falling and this coin tends to follow
• 1h RSI: 44.7, bearish momentum (below 45) → sellers have the momentum
What would tip it:
Signals are split 2 bullish against 3 bearish, so there is no edge worth paying for yet. A 1h close above 2714.77 would hand control to buyers and activate the long scenario; a 1h close below 2671.10 would do the same for sellers. Until one of those prints, the range is noise.
Which side of ETH breaks first, 2714.77 or 2671.10?
Levels mapped on the chart below.
📲 Want more of my latest signals? Join me here:
https://app.binance.com/uni-qr/D26WbL9t
⚠️ Personal market analysis only. NFA — manage risk and DYOR.
Educational content, not investment advice or a recommendation to buy, sell, deposit, or withdraw any asset. No paid promotion or referral/affiliate links.