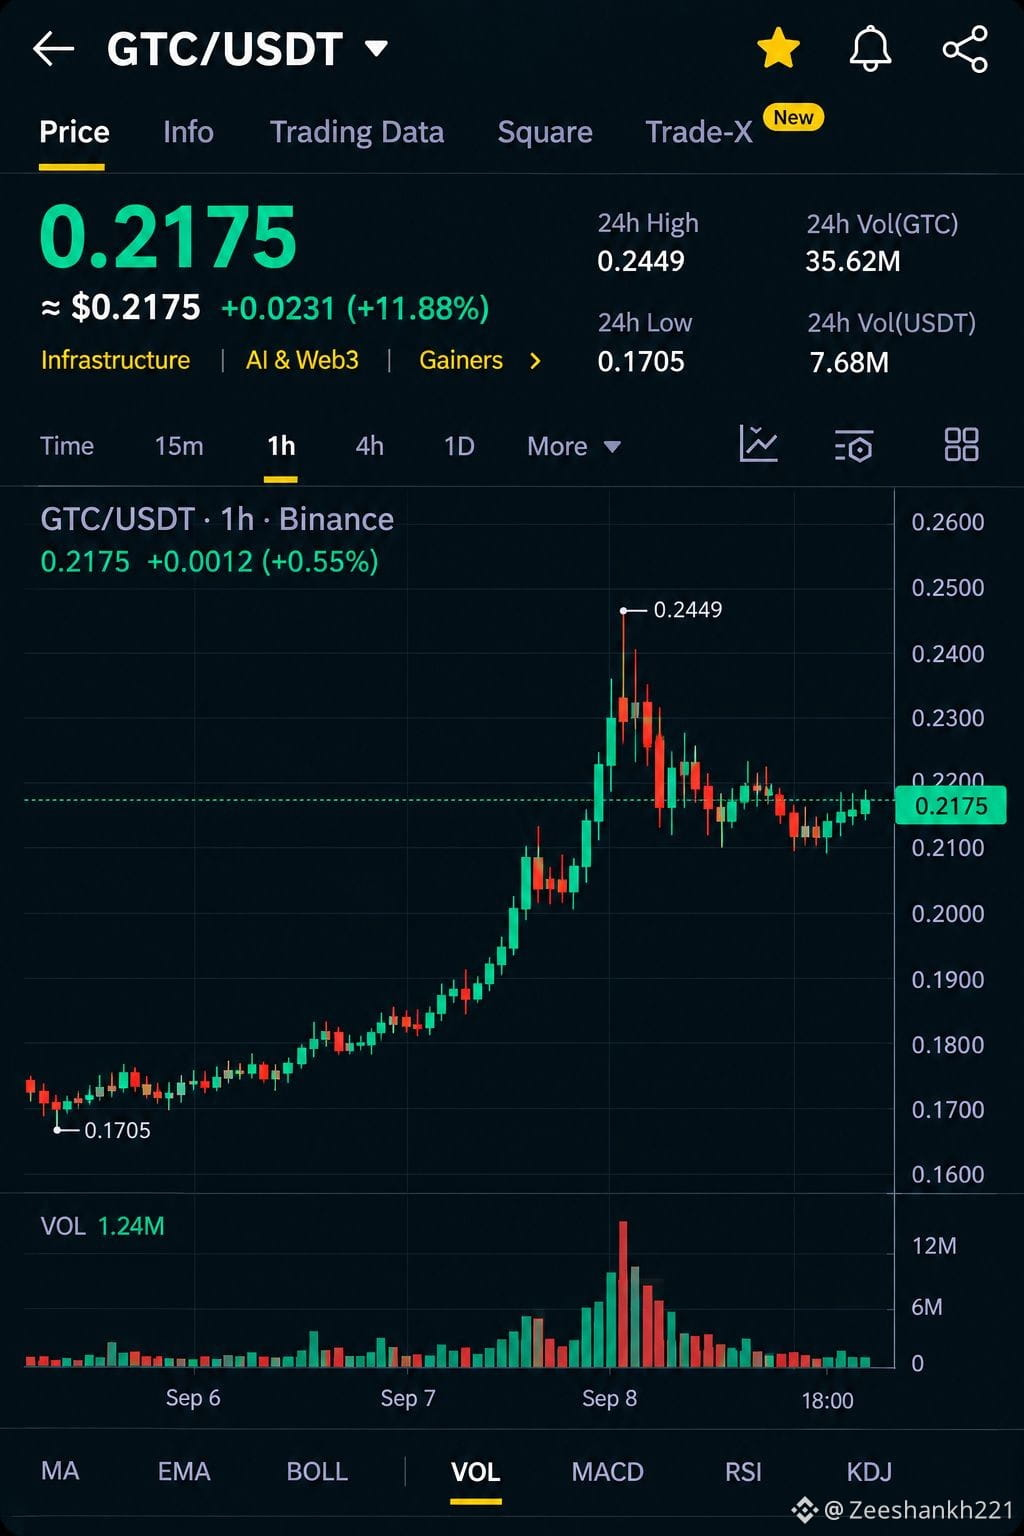
$GTC Current price: ~$0.217–$0.223
24h high: ~$0.237–$0.245
24h low: ~$0.114–$0.171 depending on the exact exchange snapshot.
GTC has experienced an extremely strong bullish move. Binance composite data shows GTC rising from around $0.115 on Oct. 4 to above $0.21 on Oct. 5, while daily volume expanded sharply.
📈 Trend: Strong Bullish — High Volatility
The 1H structure is bullish, with higher highs and higher lows. However, GTC has already moved very aggressively, so chasing the price after a large green candle carries significantly higher pullback risk.
🟢 Key Support Zones
$0.210–$0.215 — immediate support$0.195–$0.200 — secondary support$0.180–$0.185 — stronger structural support$0.170–$0.175 — major support / recent breakout area
🔴 Key Resistance Zones
$0.225–$0.230 — immediate resistance$0.237–$0.245 — major resistance / recent high$0.250–$0.260 — psychological and breakout zone
🎯 Potential Trade Setup
Aggressive long: $0.210–$0.215 after confirmation
Safer long: Wait for a 1H close above $0.237–$0.245 followed by a successful retest.
Potential upside targets after a confirmed breakout:
TP1: $0.250
TP2: $0.260
TP3: $0.280–$0.300
A loss of $0.210 could trigger a deeper retracement toward $0.195–$0.200. If $0.195 fails, $0.180–$0.185 becomes the next important area.
⚠️ Important
GTC is currently very volatile. One data source measured the 24h range at roughly 61%, while another Binance-based snapshot showed a range from about $0.114 to $0.237.
Overall: 🟢 Bullish, but heavily extended.
For an intraday trader, I'd prefer buying a confirmed pullback/retest rather than chasing the current pump.
24h high: ~$0.237–$0.245
24h low: ~$0.114–$0.171 depending on the exact exchange snapshot.
GTC has experienced an extremely strong bullish move. Binance composite data shows GTC rising from around $0.115 on Oct. 4 to above $0.21 on Oct. 5, while daily volume expanded sharply.
📈 Trend: Strong Bullish — High Volatility
The 1H structure is bullish, with higher highs and higher lows. However, GTC has already moved very aggressively, so chasing the price after a large green candle carries significantly higher pullback risk.
🟢 Key Support Zones
$0.210–$0.215 — immediate support$0.195–$0.200 — secondary support$0.180–$0.185 — stronger structural support$0.170–$0.175 — major support / recent breakout area
🔴 Key Resistance Zones
$0.225–$0.230 — immediate resistance$0.237–$0.245 — major resistance / recent high$0.250–$0.260 — psychological and breakout zone
🎯 Potential Trade Setup
Aggressive long: $0.210–$0.215 after confirmation
Safer long: Wait for a 1H close above $0.237–$0.245 followed by a successful retest.
Potential upside targets after a confirmed breakout:
TP1: $0.250
TP2: $0.260
TP3: $0.280–$0.300
A loss of $0.210 could trigger a deeper retracement toward $0.195–$0.200. If $0.195 fails, $0.180–$0.185 becomes the next important area.
⚠️ Important
GTC is currently very volatile. One data source measured the 24h range at roughly 61%, while another Binance-based snapshot showed a range from about $0.114 to $0.237.
Overall: 🟢 Bullish, but heavily extended.
For an intraday trader, I'd prefer buying a confirmed pullback/retest rather than chasing the current pump.