
‼️ BLACKROCK'S BITCOIN ETF JUST PRINTED ITS FIRST EVER GOLDEN CROSS⁉️🚨
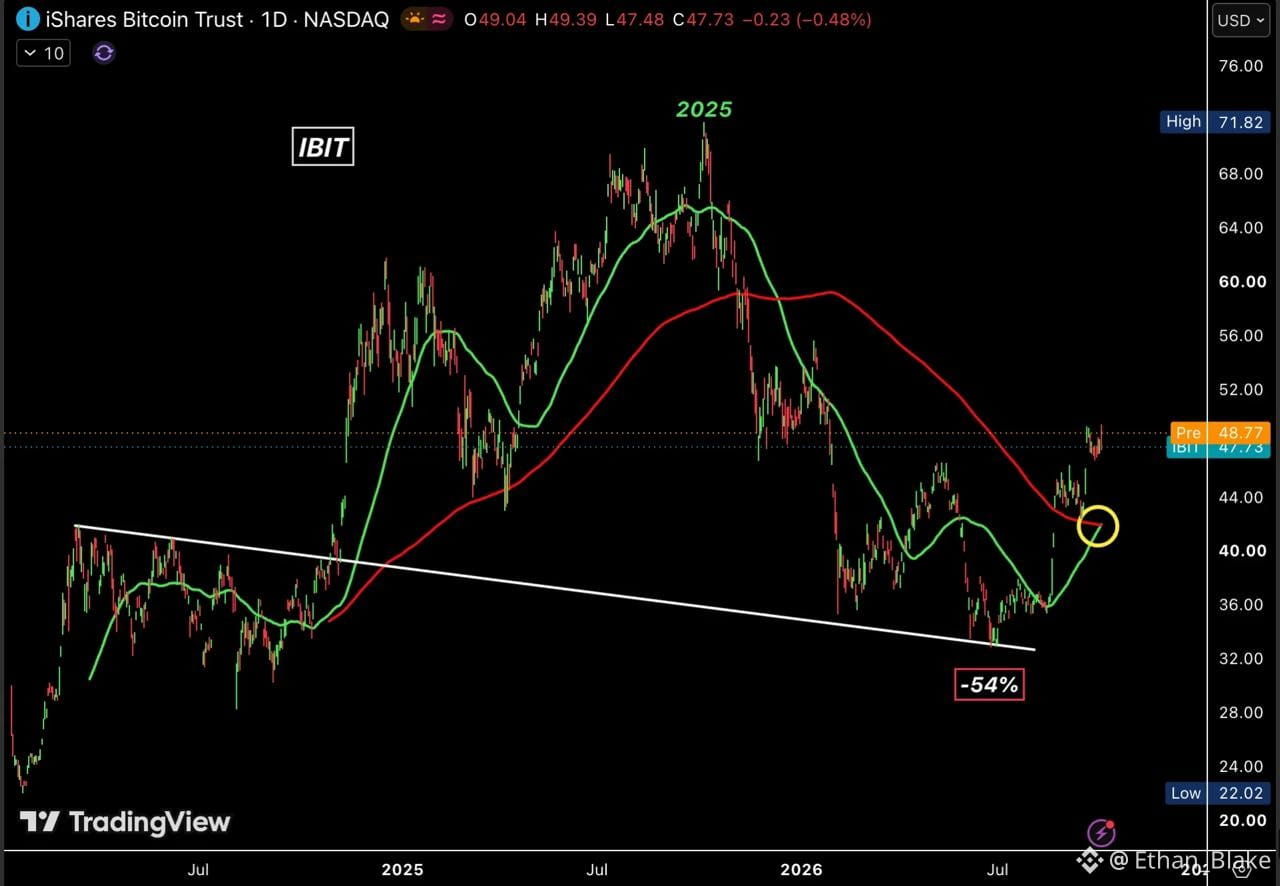
Look at this $IBIT daily chart. Price fell 54% from its 2025 high of $71.82 down to the 2026 low. The 200-day MA acted as resistance the entire way down — every bounce got sold into it. Classic bear market structure. 🎯
Then things changed. Price reclaimed both moving averages. The 50-day crossed above the 200-day. And now the first golden cross in $IBIT history is officially confirmed. The yellow circle on the chart marks the exact spot where it happened. ‼️
But — and this is the part people skip — a golden cross is a trend signal, not a buy signal. It tells you the structure is shifting, not that price goes up tomorrow. 🔥
Two scenarios from here:
· Hold above both averages: the trend stays positive
· Lose them: the trend flips negative again
Simple as that. No guessing, just levels. 👀
And this matters beyond $IBIT.ETF . BlackRock's ETF is one of the biggest institutional windows into $BTC . If its structure is turning, that's a signal worth respecting. 👀
So… is this the start of the next leg up, or just a lagging signal before another dip⁉️❓
Drop your take below. 👇
Look at this $IBIT daily chart. Price fell 54% from its 2025 high of $71.82 down to the 2026 low. The 200-day MA acted as resistance the entire way down — every bounce got sold into it. Classic bear market structure. 🎯
Then things changed. Price reclaimed both moving averages. The 50-day crossed above the 200-day. And now the first golden cross in $IBIT history is officially confirmed. The yellow circle on the chart marks the exact spot where it happened. ‼️
But — and this is the part people skip — a golden cross is a trend signal, not a buy signal. It tells you the structure is shifting, not that price goes up tomorrow. 🔥
Two scenarios from here:
· Hold above both averages: the trend stays positive
· Lose them: the trend flips negative again
Simple as that. No guessing, just levels. 👀
And this matters beyond $IBIT.ETF . BlackRock's ETF is one of the biggest institutional windows into $BTC . If its structure is turning, that's a signal worth respecting. 👀
So… is this the start of the next leg up, or just a lagging signal before another dip⁉️❓
Drop your take below. 👇