



SUI/USDT Technical Analysis Overview
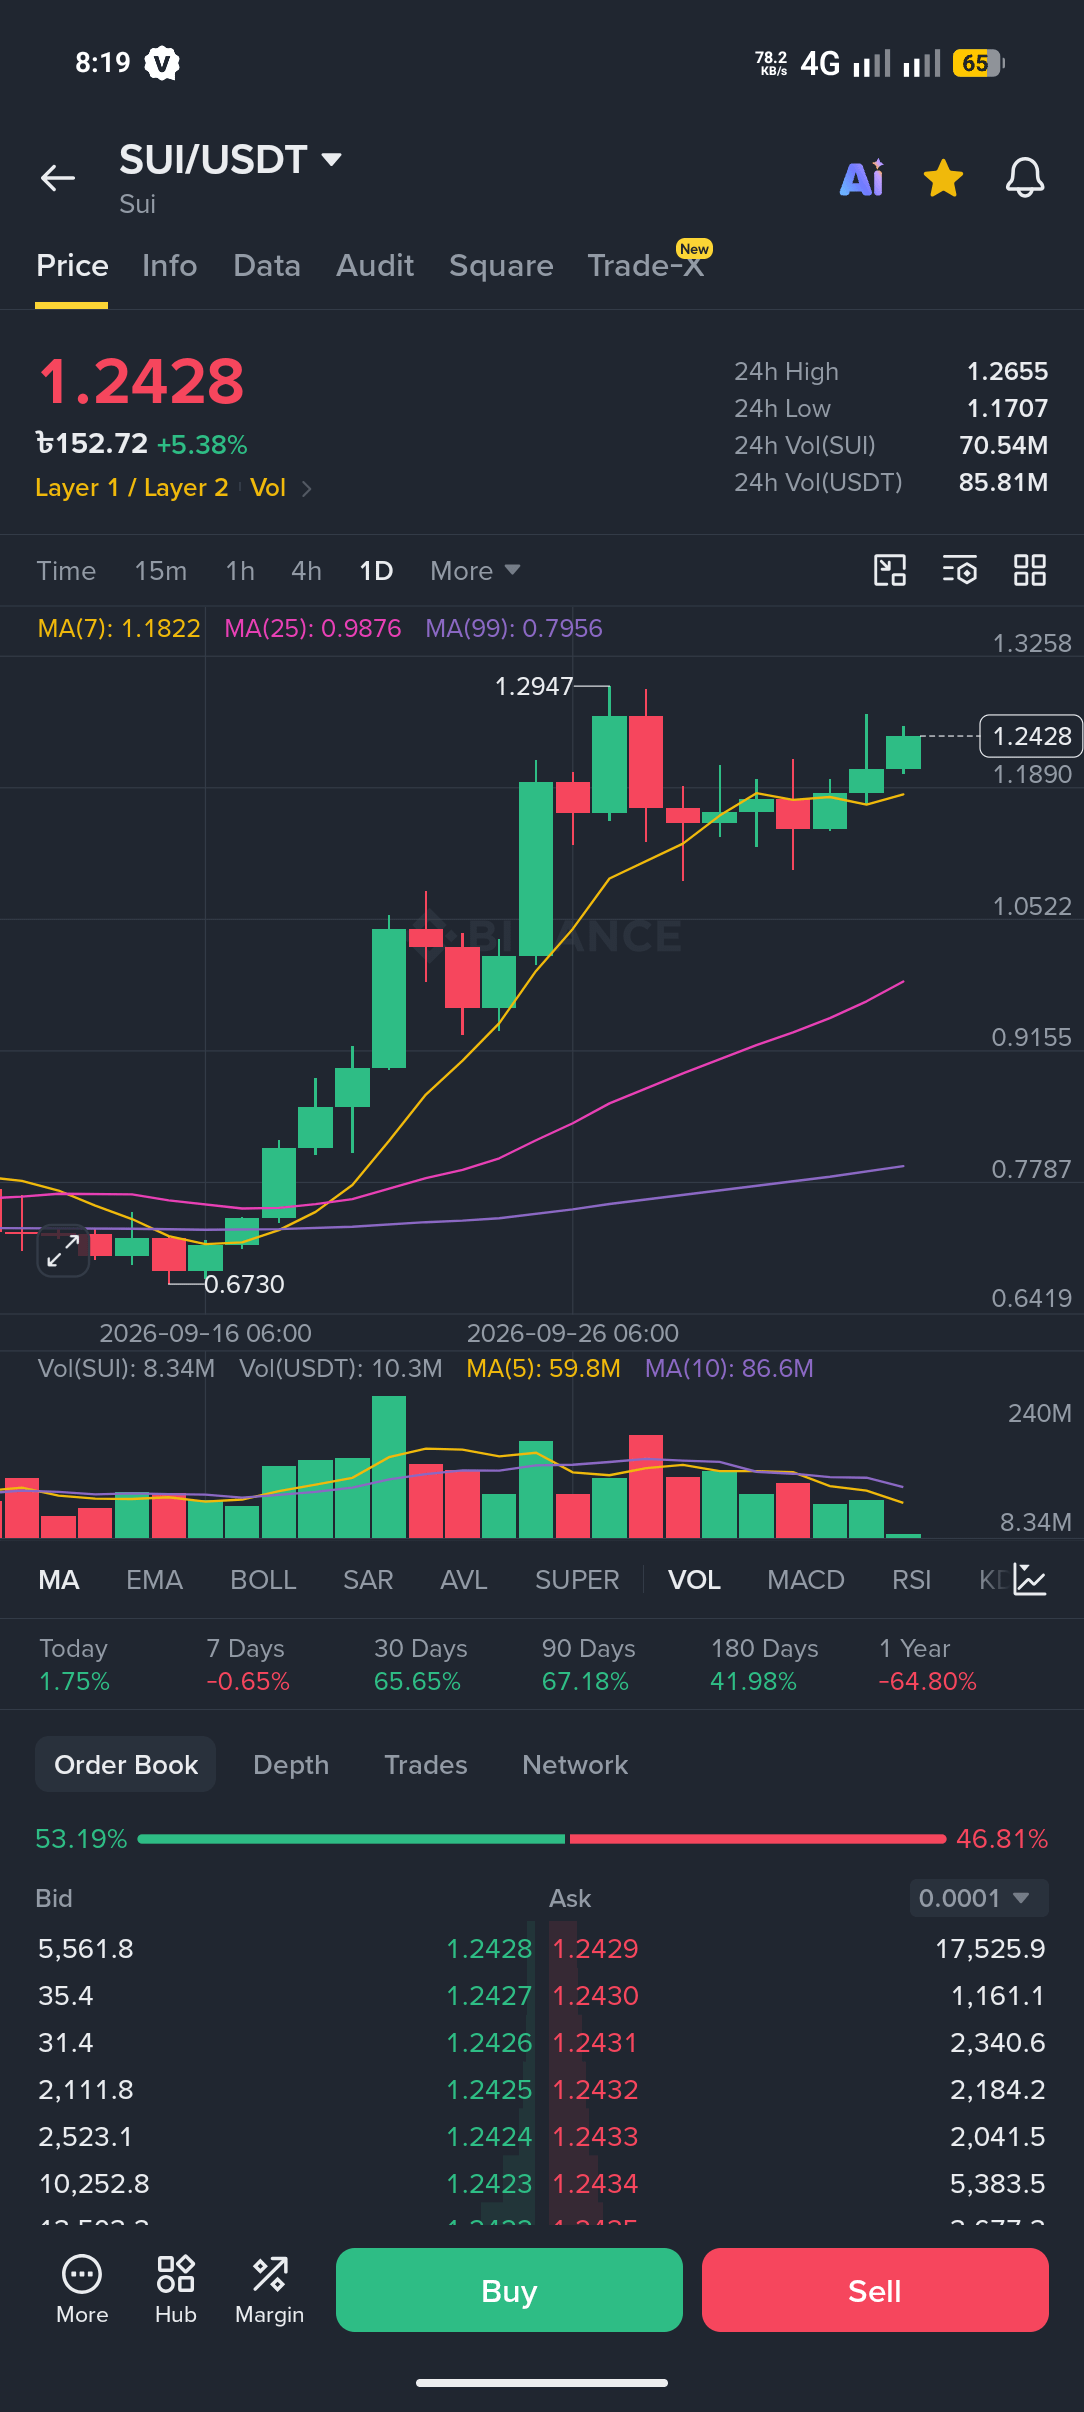
SUI is currently trading around $1.2428 (+5.38% daily gain). The token recently pulled back from its daily high of $1.2947 after strong bullish momentum from the $0.6730 swing low.
Key Technical Indicators
Moving Averages (MA):
MA(7): $1.1822 — Short-term trend support.
MA(25): $0.9876 — Medium-term trend support.
MA(99): $0.7956 — Long-term baseline support.
Signal: The price is trading above all three MAs, with a healthy spread confirming an overall uptrend.
24h Volume & Order Book:
24h High / Low: $1.2655 / $1.1707
Volume: $85.81M USDT
Order Book Sentiment: 53.19% Bids vs 46.81% Asks (Slight buyer control).
Short-Term Market Outlook
Resistance: $1.2650 - $1.2950 (Recent local peak). A breakout above $1.2950 opens up targets toward $1.32+.
Support: $1.1820 (MA 7 support zone). Losing this level could test secondary support near $1.05.
Verdict: Bullish Consolidation. The price is consolidating below peak resistance following a major rally. Holding above $1.18 keeps buyer momentum intact.
