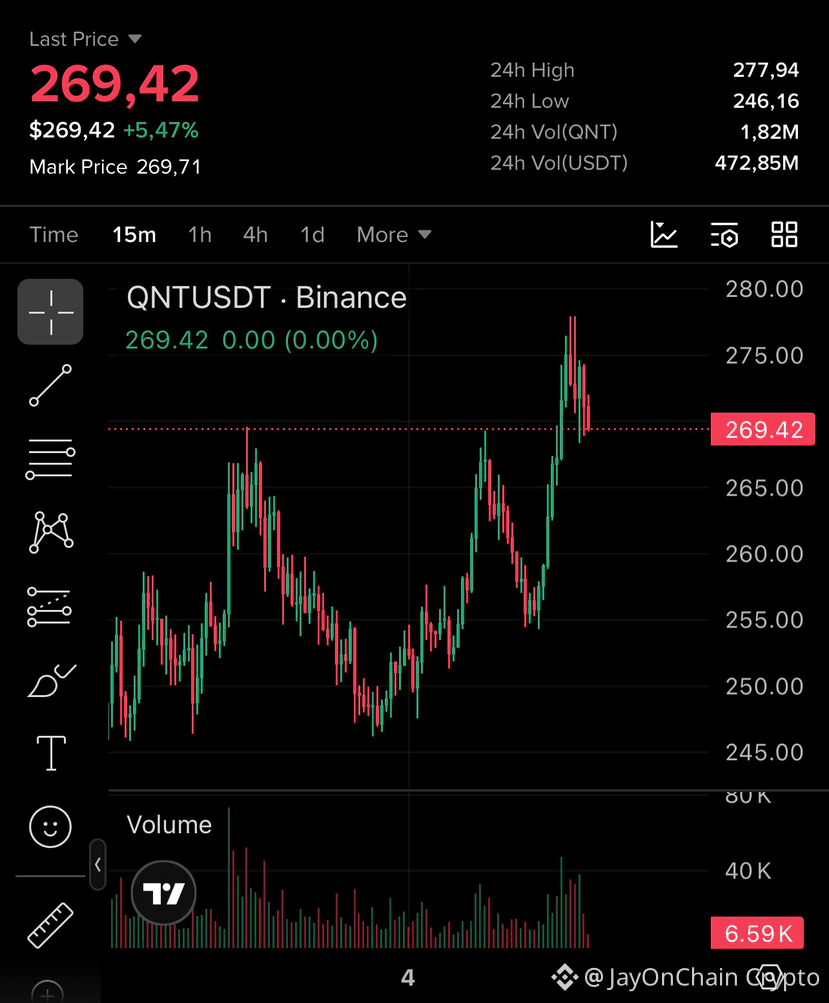
Technical Breakdown: $QNT /USDT (15m Timeframe)
Heavy Liquidity Rejection at the Peak: The price surged past prior local highs up to 277.94 (24h High), but encountered immediate, aggressive selling. The 15m chart shows a sharp rejection with consecutive red candles pulling the price down to 269.42.
Unfavorable Risk-to-Reward: Buying directly after an extended impulse and a fresh rejection exposes you to an imminent drop toward prior resistance-turned-support around 264.00 – 266.00.
Better Execution Plan:
Patience for a Dip (Safer Long): Wait for price to pull back and consolidate around the 263.00 – 266.00 zone. If strong absorption wicks form there, that provides a defined risk setup.
Breakout Confirmation: Alternatively, only enter Long if the price reclaims and closes firmly above 274.50 on increasing volume.
Actionable Long Setup (Wait for Pullback)
If you want to play the higher-timeframe bullish trend, wait for the corrective wave to settle first:
Position: LONG $QNT (Limit order / Dip buy)
Ideal Entry Zone: 263.50 – 266.50 (Retest of previous breakout shelf)
Stop Loss (SL): 258.80 (~2.0% – 2.9% risk; structural breakdown below the local support shelf)
Take Profit Targets:
TP1: 271.50 (Local bounce retest)
TP2: 277.50 (Retesting 24h High liquidity pool at 277.94)
TP3: 284.00 (Fibonacci extension target)
Heavy Liquidity Rejection at the Peak: The price surged past prior local highs up to 277.94 (24h High), but encountered immediate, aggressive selling. The 15m chart shows a sharp rejection with consecutive red candles pulling the price down to 269.42.
Unfavorable Risk-to-Reward: Buying directly after an extended impulse and a fresh rejection exposes you to an imminent drop toward prior resistance-turned-support around 264.00 – 266.00.
Better Execution Plan:
Patience for a Dip (Safer Long): Wait for price to pull back and consolidate around the 263.00 – 266.00 zone. If strong absorption wicks form there, that provides a defined risk setup.
Breakout Confirmation: Alternatively, only enter Long if the price reclaims and closes firmly above 274.50 on increasing volume.
Actionable Long Setup (Wait for Pullback)
If you want to play the higher-timeframe bullish trend, wait for the corrective wave to settle first:
Position: LONG $QNT (Limit order / Dip buy)
Ideal Entry Zone: 263.50 – 266.50 (Retest of previous breakout shelf)
Stop Loss (SL): 258.80 (~2.0% – 2.9% risk; structural breakdown below the local support shelf)
Take Profit Targets:
TP1: 271.50 (Local bounce retest)
TP2: 277.50 (Retesting 24h High liquidity pool at 277.94)
TP3: 284.00 (Fibonacci extension target)