Market recap,...
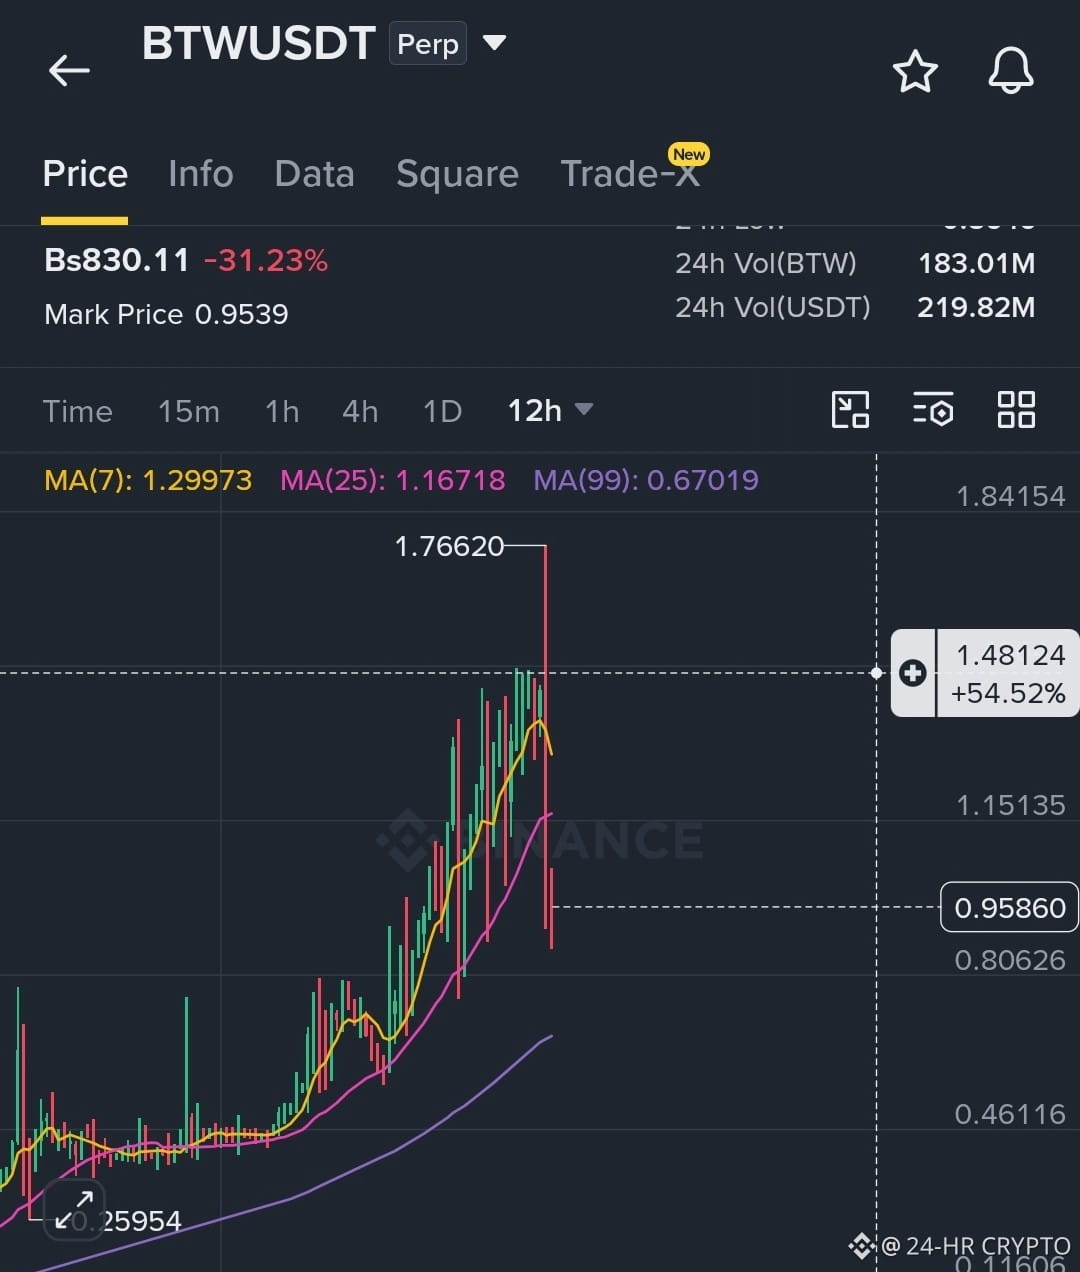
$BTW USDT 12-hour chart shows a severe flash dump following a strong uptrend. Price peaked near 1.766 before plunging to 0.958, breaking below short-term moving averages MA(7) and MA(25). Heavy downside momentum suggests high volatility, with dynamic support now near the 0.670 MA(99) level.
$ZEC
$BTW USDT 12-hour chart shows a severe flash dump following a strong uptrend. Price peaked near 1.766 before plunging to 0.958, breaking below short-term moving averages MA(7) and MA(25). Heavy downside momentum suggests high volatility, with dynamic support now near the 0.670 MA(99) level.
$ZEC