$BTC $SPORTFUN $AIN
HOW TO ANALYZE A CRYPTO CHART LIKE A BOSS: 📊🔥
1. MARKET STRUCTURE & TRENDS 📈
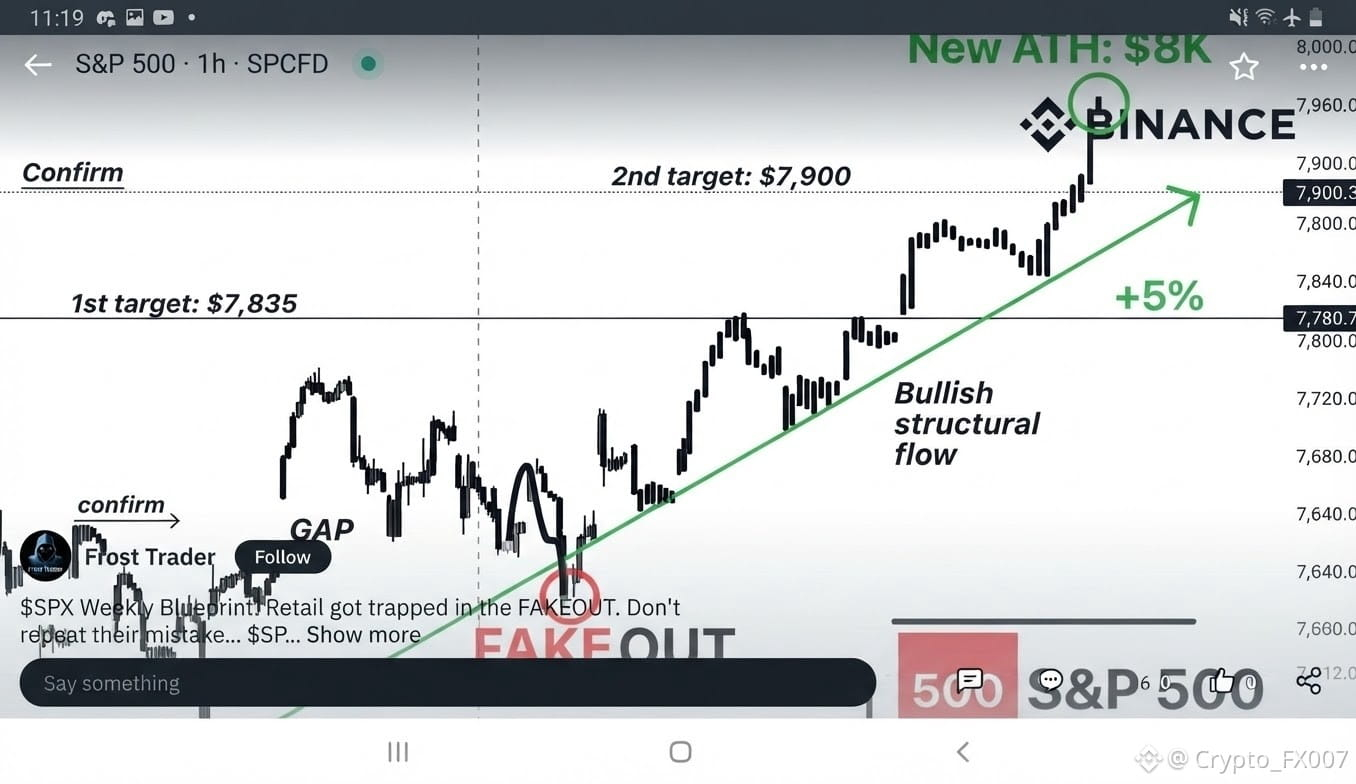
- Identify the main trend: Uptrend (Higher Highs & Higher Lows) or Downtrend (Lower Lows & Lower Highs). Never fight the trend, ride it!
2. SUPPORT & RESISTANCE (S&R) 🛑🎯
- Support: Price floor where buyers step in heavily.
- Resistance: Price ceiling where sellers take control. Watch how price reacts here for breakouts or rejections.
3. TECHNICAL INDICATORS ⚡
- Use Moving Averages (MA) to check trend direction and momentum.
- Use RSI (Relative Strength Index) to spot overbought (>70) or oversold (<30) zones.
4. VOLUME & ORDER BOOK 📊
- High volume confirms the strength of a move. Always check if buyers or sellers are dominating the order flow.
HOW TO ANALYZE A CRYPTO CHART LIKE A BOSS: 📊🔥
1. MARKET STRUCTURE & TRENDS 📈
- Identify the main trend: Uptrend (Higher Highs & Higher Lows) or Downtrend (Lower Lows & Lower Highs). Never fight the trend, ride it!
2. SUPPORT & RESISTANCE (S&R) 🛑🎯
- Support: Price floor where buyers step in heavily.
- Resistance: Price ceiling where sellers take control. Watch how price reacts here for breakouts or rejections.
3. TECHNICAL INDICATORS ⚡
- Use Moving Averages (MA) to check trend direction and momentum.
- Use RSI (Relative Strength Index) to spot overbought (>70) or oversold (<30) zones.
4. VOLUME & ORDER BOOK 📊
- High volume confirms the strength of a move. Always check if buyers or sellers are dominating the order flow.