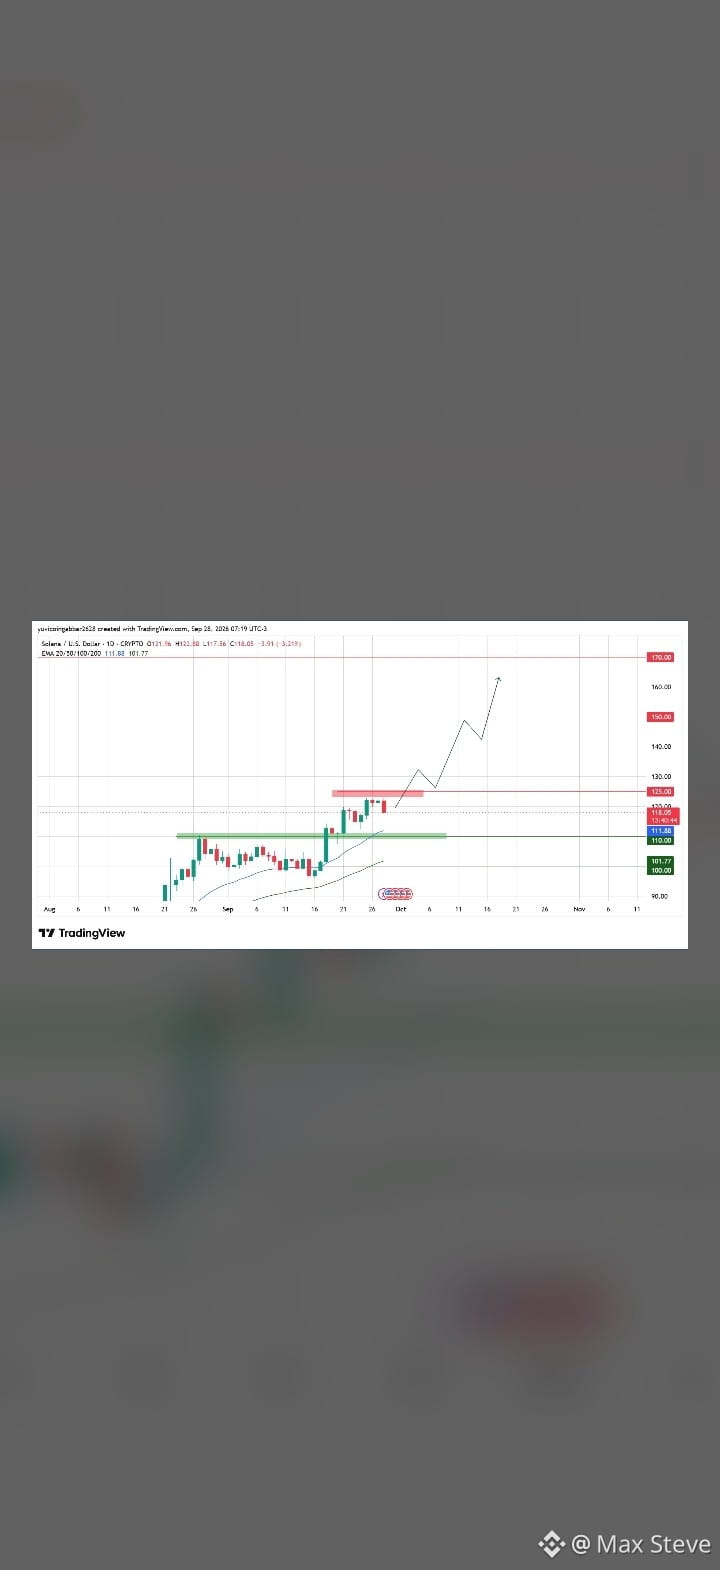
$SOL
#ICBASuesOCCOverCryptoBankCharters #G7PlansToReleaseUpTo100MBarrelsOilDiesel #NFPWatch #SECProposesCryptoCustodyRules
Solana (SOL/USD) Technical Analysis
Current Market Overview:
Current Price: ~$121 – $123
Key Support Zone: $112 – $114 (20-day EMA)
Immediate Resistance: $125 – $128
Breakout Target: $135 – $145
Key Technical Highlights
Rising Channel & Structure: Solana is maintaining an intact ascending parallel channel on daily timeframes. Price action holds cleanly above its 20-day EMA ($114.43), reflecting sustained buyer demand following strong network momentum.
Momentum & Derivatives:
Short Squeezes: Over $7.7M in short positions were liquidated across major exchanges, pushing price briefly toward $124.
Indicators: Relative Strength Index (RSI) sits near 54 in the mid-expansion zone, giving buyers room to extend the rally toward overhead channel boundaries.
Fundamentals & Catalysts:
Real-World Integrations: Enterprise interest remains strong with live stablecoin infrastructure integrations on the Solana network.
Macro Factors: Sustained institutional ETF inflows and market stability ahead of upcoming central bank rate decisions continue to support the trend.
Key Scenarios to Watch
Bullish Case: A clear daily close above $125 confirms the upward continuation, aiming for the upper channel line at $135 with potential expansion toward $145.
Bearish Case: Losing the primary $114 support breaks the local trend structure, risking a retest of lower support near the 50-day EMA at $104.40.
#ICBASuesOCCOverCryptoBankCharters #G7PlansToReleaseUpTo100MBarrelsOilDiesel #NFPWatch #SECProposesCryptoCustodyRules
Solana (SOL/USD) Technical Analysis
Current Market Overview:
Current Price: ~$121 – $123
Key Support Zone: $112 – $114 (20-day EMA)
Immediate Resistance: $125 – $128
Breakout Target: $135 – $145
Key Technical Highlights
Rising Channel & Structure: Solana is maintaining an intact ascending parallel channel on daily timeframes. Price action holds cleanly above its 20-day EMA ($114.43), reflecting sustained buyer demand following strong network momentum.
Momentum & Derivatives:
Short Squeezes: Over $7.7M in short positions were liquidated across major exchanges, pushing price briefly toward $124.
Indicators: Relative Strength Index (RSI) sits near 54 in the mid-expansion zone, giving buyers room to extend the rally toward overhead channel boundaries.
Fundamentals & Catalysts:
Real-World Integrations: Enterprise interest remains strong with live stablecoin infrastructure integrations on the Solana network.
Macro Factors: Sustained institutional ETF inflows and market stability ahead of upcoming central bank rate decisions continue to support the trend.
Key Scenarios to Watch
Bullish Case: A clear daily close above $125 confirms the upward continuation, aiming for the upper channel line at $135 with potential expansion toward $145.
Bearish Case: Losing the primary $114 support breaks the local trend structure, risking a retest of lower support near the 50-day EMA at $104.40.