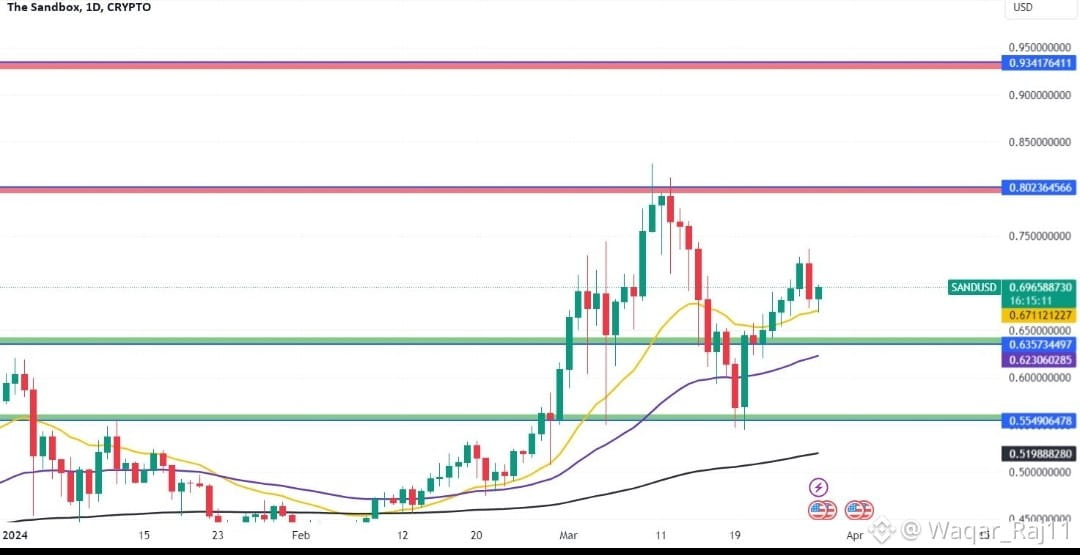
SAND — latest chart view
As of 2 Oct 2026, SAND is around $0.0657, up about 53% in 24 hours, with roughly $403M in 24h volume. The intraday range has been approximately $0.0425–$0.0726.
Key levels to watch:
🔴 $0.072–0.074 — immediate resistance / recent high
🟠 $0.080 — next psychological resistance
🟢 $0.060–0.062 — important pullback/support area
🟢 $0.050–0.055 — deeper support
🟢 $0.043–0.045 — major breakout/base area
Technically, momentum is very strong, but several oscillators are already overbought. Investing.com's Oct. 2 reading had RSI around 71, StochRSI at 100, and CCI around 267. A separate analysis today reported RSI readings approaching extreme levels after the breakout.
The important chart question now: can SAND hold the $0.060–0.062 area after the large spike? Holding it would show that the breakout is being accepted; losing it would increase the possibility of a deeper retracement.
If you give me your SAND entry price, I can make a visual chart with your entry + stop-loss + $0.08, $0.10, $0.20 and $0.50 target levels.$SAND
#BitcoinFundingRateTriplesTo10% #NFPWatch #ZcashFalls21%FromSeptemberPeak
As of 2 Oct 2026, SAND is around $0.0657, up about 53% in 24 hours, with roughly $403M in 24h volume. The intraday range has been approximately $0.0425–$0.0726.
Key levels to watch:
🔴 $0.072–0.074 — immediate resistance / recent high
🟠 $0.080 — next psychological resistance
🟢 $0.060–0.062 — important pullback/support area
🟢 $0.050–0.055 — deeper support
🟢 $0.043–0.045 — major breakout/base area
Technically, momentum is very strong, but several oscillators are already overbought. Investing.com's Oct. 2 reading had RSI around 71, StochRSI at 100, and CCI around 267. A separate analysis today reported RSI readings approaching extreme levels after the breakout.
The important chart question now: can SAND hold the $0.060–0.062 area after the large spike? Holding it would show that the breakout is being accepted; losing it would increase the possibility of a deeper retracement.
If you give me your SAND entry price, I can make a visual chart with your entry + stop-loss + $0.08, $0.10, $0.20 and $0.50 target levels.$SAND
#BitcoinFundingRateTriplesTo10% #NFPWatch #ZcashFalls21%FromSeptemberPeak