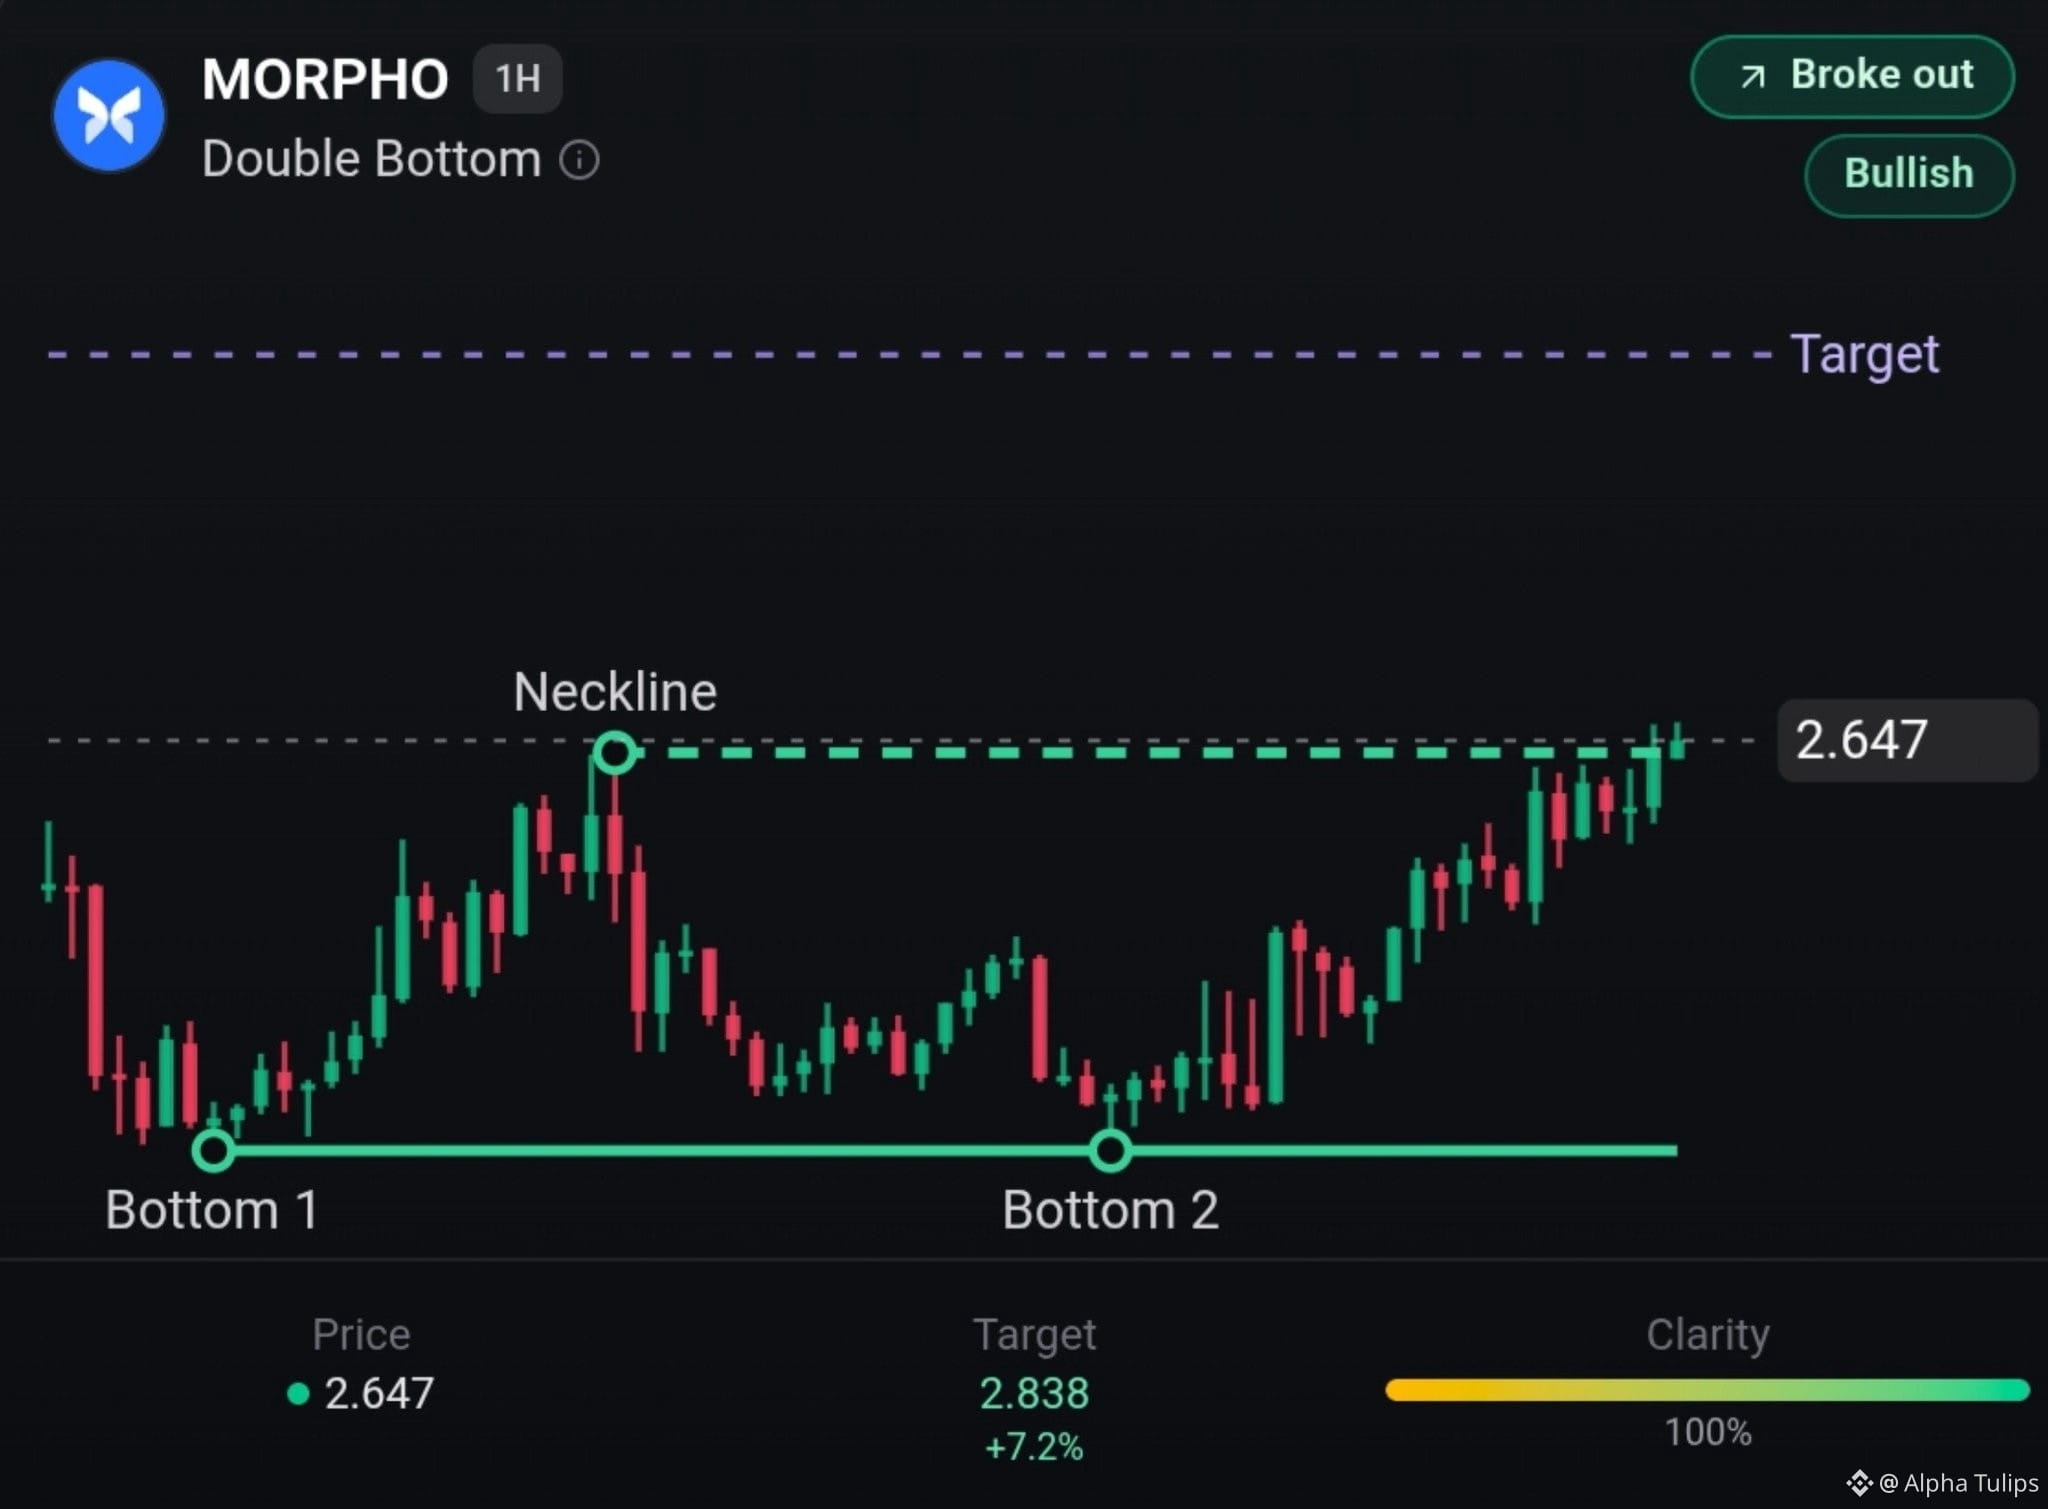
The $MORPHO 1-hour chart currently displays a Double Bottom pattern, which is a bullish signal indicating that the price has successfully tested the same low twice. The asset has just broken out above its neckline, suggesting the potential for an upward rally.
Key levels
$2.444: This represents the support level where the price held steady during both the first and second bottoms.
$2.641: This is the neckline of the pattern, which the price has successfully surpassed to confirm the breakout.
$2.838: This is the current target price identified by the pattern.
What to watch
A sustained move above the neckline at $2.641 supports the bullish bias and the potential to reach the target of $2.838.
If the price fails to maintain its position above the neckline, the breakout may be invalidated.
Risk: Market conditions can change rapidly, and a breakout does not guarantee that the price will reach the target.
Key levels
$2.444: This represents the support level where the price held steady during both the first and second bottoms.
$2.641: This is the neckline of the pattern, which the price has successfully surpassed to confirm the breakout.
$2.838: This is the current target price identified by the pattern.
What to watch
A sustained move above the neckline at $2.641 supports the bullish bias and the potential to reach the target of $2.838.
If the price fails to maintain its position above the neckline, the breakout may be invalidated.
Risk: Market conditions can change rapidly, and a breakout does not guarantee that the price will reach the target.