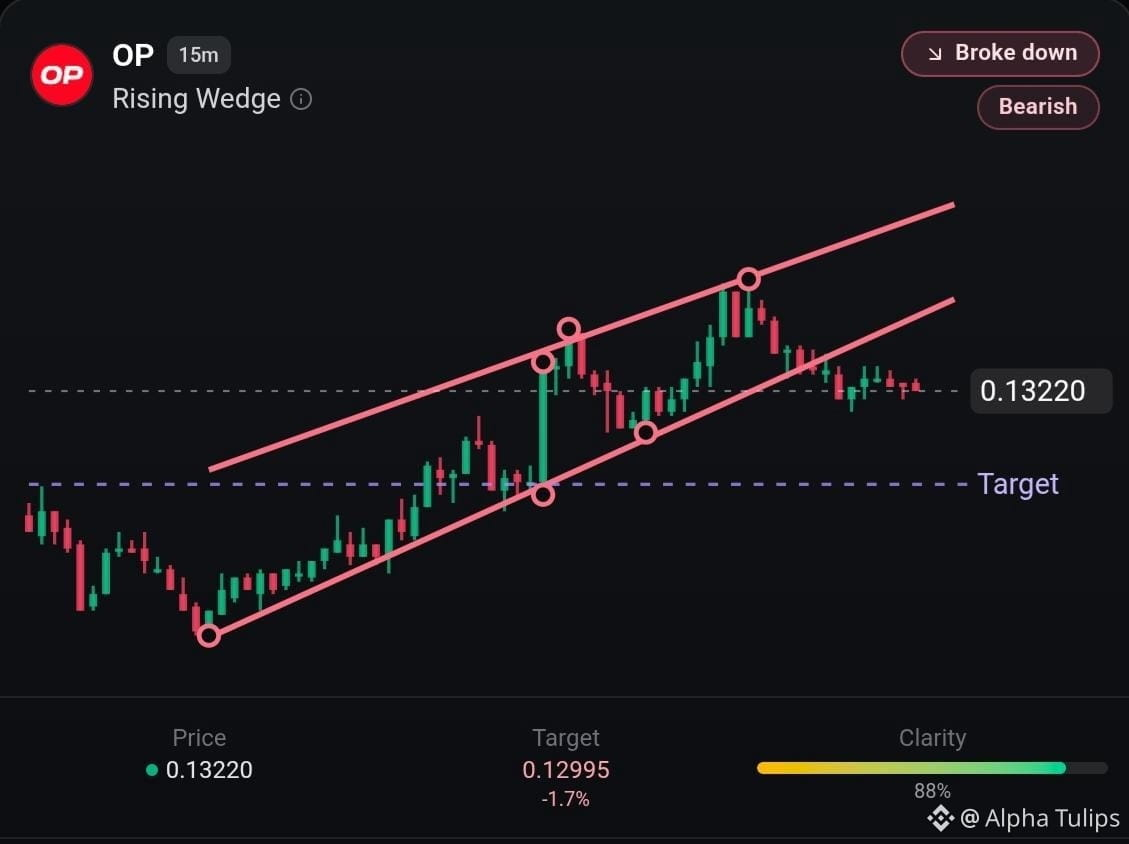
The chart for $OP
on the 15-minute timeframe shows a rising wedge pattern that has just broken down. This pattern indicates that buyers are losing strength, which typically leads to a downward price movement.
Key levels
$0.1349: The upper boundary of the wedge representing recent resistance.
$0.1322: The current price level following the recent breakdown.
$0.1299: The projected target price for this downward move.
$0.1263: A lower support level identified within the chart data.
What to watch
The pattern has an 88% clarity rating, suggesting a high likelihood that the current bearish bias will continue toward the target of $0.1299.
A failure to sustain momentum below $0.1322 could confirm the breakdown, while a move back above the wedge would invalidate the current bearish outlook.
Risk: Trading crypto assets involves significant volatility and the potential for rapid price changes.
on the 15-minute timeframe shows a rising wedge pattern that has just broken down. This pattern indicates that buyers are losing strength, which typically leads to a downward price movement.
Key levels
$0.1349: The upper boundary of the wedge representing recent resistance.
$0.1322: The current price level following the recent breakdown.
$0.1299: The projected target price for this downward move.
$0.1263: A lower support level identified within the chart data.
What to watch
The pattern has an 88% clarity rating, suggesting a high likelihood that the current bearish bias will continue toward the target of $0.1299.
A failure to sustain momentum below $0.1322 could confirm the breakdown, while a move back above the wedge would invalidate the current bearish outlook.
Risk: Trading crypto assets involves significant volatility and the potential for rapid price changes.