📊 Market Divergence: Steady Climb vs. Massive Sell-Off 🚨
Comparing these two charts from the same timeframe reveals exactly how brutal the current altcoin market can be. We are seeing a massive divergence in price action:
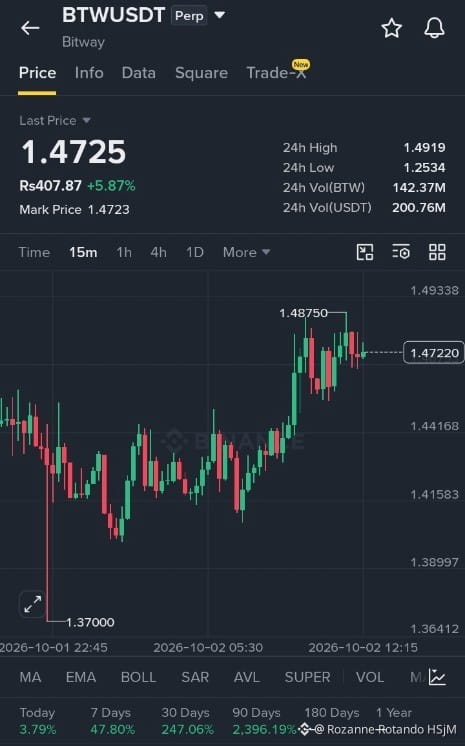
📈$BTW
USDT (Perp)
· Last Price: 1.4725
· 24h Change: +5.87% 🟢
· 24h Volume (USDT): 200.76M
· Trend: A textbook uptrend. After a brief dip to 1.37000, the price steadily climbed, breaking highs to reach 1.4919. The momentum looks healthy and controlled.
📉 $龙虾
USDT (Lobster/USDT)
· Last Price: 0.02797
· 24h Change: -35.77% 🔴
· 24h Volume (USDT): 797.23M
· Trend: Absolute freefall. The chart shows a relentless waterfall drop from a high of 0.113960 down to the current level. Despite the massive trading volume, there is no support in sight, completely wiping out recent gains.
$ZEC
💡 Key Takeaways:
1. Extreme Risk in Meme/Altcoins: The "Lobster" chart is a classic example of a high-risk asset experiencing a liquidity crunch. A 35% drop in 24 hours, following a massive 30-day gain (still showing +109.8% on the 90-day metric), shows how quickly profits can be erased in volatile sectors.
2. Capital Rotation: We are likely seeing capital rotating out of highly speculative assets (like Lobster) and into assets showing more stable, sustained momentum (like BTW).
3. The Volume Paradox: Notice that "Lobster" has a higher 24h USDT volume (797M) than "BTW" (200M), yet its price is collapsing. This indicates massive panic selling and capitulation.
⚠️ A Note on the Data:
As noted in previous posts, the X-axis on these charts shows dates in October 2026. This strongly suggests these are simulated trading environments, testnet data, or modified charts, rather than live market feeds. Always verify your platform before trading.
Which side of this divergence are you trading today? Let me know in the comments! 👇
#Crypto #Trading #Altcoins #MarketUpdate #
Comparing these two charts from the same timeframe reveals exactly how brutal the current altcoin market can be. We are seeing a massive divergence in price action:
📈$BTW
USDT (Perp)
· Last Price: 1.4725
· 24h Change: +5.87% 🟢
· 24h Volume (USDT): 200.76M
· Trend: A textbook uptrend. After a brief dip to 1.37000, the price steadily climbed, breaking highs to reach 1.4919. The momentum looks healthy and controlled.
📉 $龙虾
USDT (Lobster/USDT)
· Last Price: 0.02797
· 24h Change: -35.77% 🔴
· 24h Volume (USDT): 797.23M
· Trend: Absolute freefall. The chart shows a relentless waterfall drop from a high of 0.113960 down to the current level. Despite the massive trading volume, there is no support in sight, completely wiping out recent gains.
$ZEC
💡 Key Takeaways:
1. Extreme Risk in Meme/Altcoins: The "Lobster" chart is a classic example of a high-risk asset experiencing a liquidity crunch. A 35% drop in 24 hours, following a massive 30-day gain (still showing +109.8% on the 90-day metric), shows how quickly profits can be erased in volatile sectors.
2. Capital Rotation: We are likely seeing capital rotating out of highly speculative assets (like Lobster) and into assets showing more stable, sustained momentum (like BTW).
3. The Volume Paradox: Notice that "Lobster" has a higher 24h USDT volume (797M) than "BTW" (200M), yet its price is collapsing. This indicates massive panic selling and capitulation.
⚠️ A Note on the Data:
As noted in previous posts, the X-axis on these charts shows dates in October 2026. This strongly suggests these are simulated trading environments, testnet data, or modified charts, rather than live market feeds. Always verify your platform before trading.
Which side of this divergence are you trading today? Let me know in the comments! 👇
#Crypto #Trading #Altcoins #MarketUpdate #