🚨 Market Anomaly Alert: Extreme Volatility in "$US
" and "Lobster" Pairs 🚨
Take a look at these two charts. At first glance, they show completely opposite trends, but a closer look reveals some highly unusual data that every trader needs to be aware of.
Here is the breakdown of what these screenshots show:
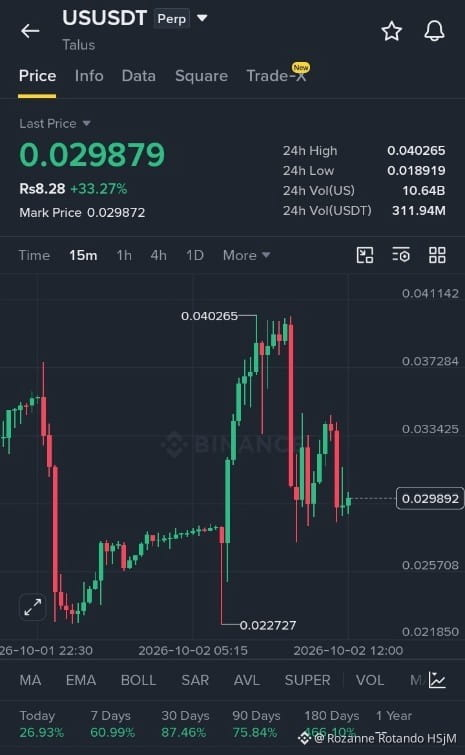
📈 Chart 1: USUSDT (Perp)
· Price: 0.029879
· 24h Change: +33.27%
· 24h Volume (USDT): 311.94M
· Trend: A sharp initial drop, followed by a strong V-shaped recovery and consolidation.
📉 $龙虾
USDT (Lobster/USDT)
· Price: 0.02797
· 24h Change: -35.77%
· 24h Volume (USDT): 797.23M
· Trend: A brutal, continuous waterfall drop from a high of 0.113960 down to the current level.
$MAGMA
⚠️ The Major Red Flags Here:
1. The "Stablecoin" Paradox: If "US" in the first chart stands for USDT (Tether), a price of $0.029 is impossible. USDT is supposed to be pegged 1:1 to the US Dollar. A price this low indicates this is likely not a standard stablecoin pair, but rather a specific platform token, a testnet, or a simulated trading environment.
2. Extreme Divergence: While "US" is up 33%, "Lobster" is down nearly 36%, crashing from $0.11 to $0.02. This kind of divergence in a single session is incredibly rare in normal market conditions.
3. Future Timestamps: Notice the dates on the X-axis: October 1-2, 2026. This confirms that these charts are either from a simulated trading competition, a test environment, or modified screenshots. They do not represent current, real-time market data.
💡 Key Takeaway:
If you are trading in a real environment and see charts like this, proceed with extreme caution. A coin crashing 35% in 24 hours ("Lobster") indicates severe liquidity exhaustion or massive sell pressure. Meanwhile, a token named "US" trading at $0.03 carries immense de-peg or platform risk.
Always verify the contract
" and "Lobster" Pairs 🚨
Take a look at these two charts. At first glance, they show completely opposite trends, but a closer look reveals some highly unusual data that every trader needs to be aware of.
Here is the breakdown of what these screenshots show:
📈 Chart 1: USUSDT (Perp)
· Price: 0.029879
· 24h Change: +33.27%
· 24h Volume (USDT): 311.94M
· Trend: A sharp initial drop, followed by a strong V-shaped recovery and consolidation.
📉 $龙虾
USDT (Lobster/USDT)
· Price: 0.02797
· 24h Change: -35.77%
· 24h Volume (USDT): 797.23M
· Trend: A brutal, continuous waterfall drop from a high of 0.113960 down to the current level.
$MAGMA
⚠️ The Major Red Flags Here:
1. The "Stablecoin" Paradox: If "US" in the first chart stands for USDT (Tether), a price of $0.029 is impossible. USDT is supposed to be pegged 1:1 to the US Dollar. A price this low indicates this is likely not a standard stablecoin pair, but rather a specific platform token, a testnet, or a simulated trading environment.
2. Extreme Divergence: While "US" is up 33%, "Lobster" is down nearly 36%, crashing from $0.11 to $0.02. This kind of divergence in a single session is incredibly rare in normal market conditions.
3. Future Timestamps: Notice the dates on the X-axis: October 1-2, 2026. This confirms that these charts are either from a simulated trading competition, a test environment, or modified screenshots. They do not represent current, real-time market data.
💡 Key Takeaway:
If you are trading in a real environment and see charts like this, proceed with extreme caution. A coin crashing 35% in 24 hours ("Lobster") indicates severe liquidity exhaustion or massive sell pressure. Meanwhile, a token named "US" trading at $0.03 carries immense de-peg or platform risk.
Always verify the contract