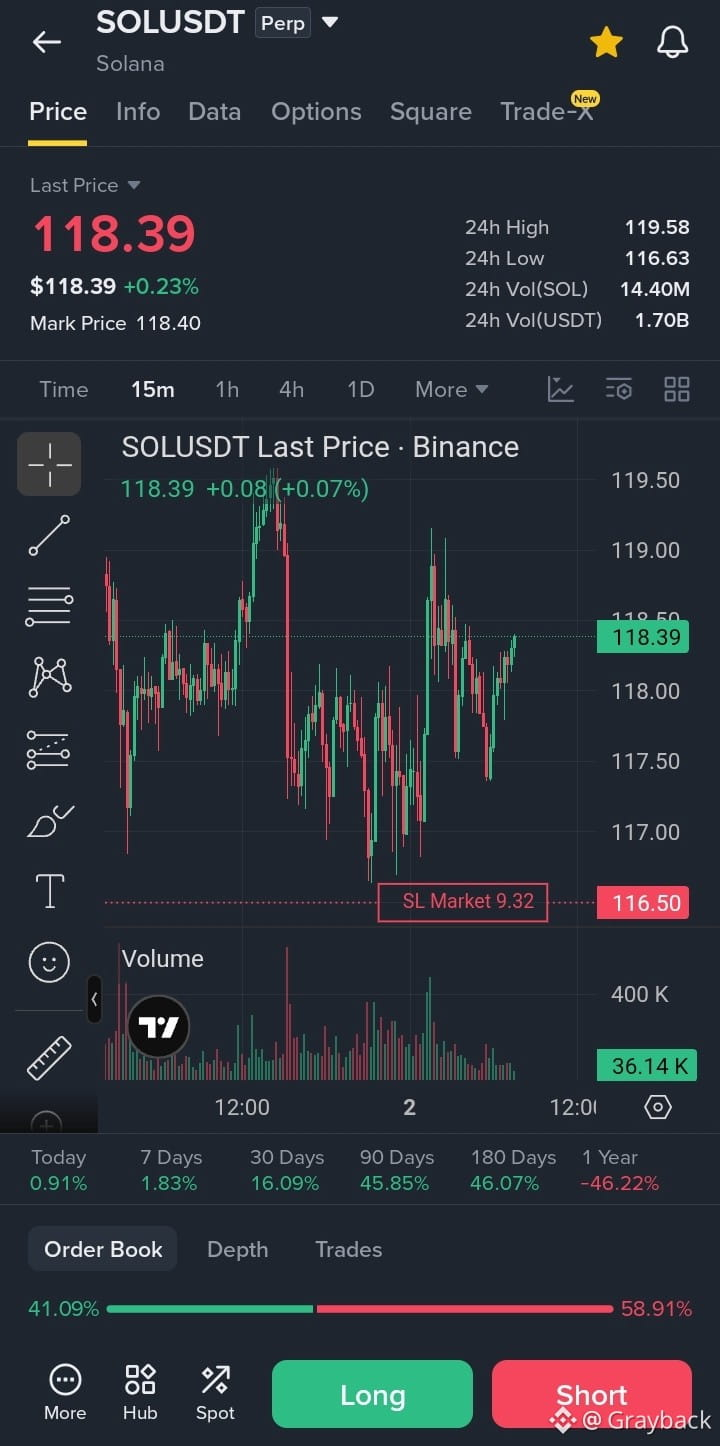
🚨🚨 $SOL Consolidation: Liquidity Trap or Explosive Compression? 📈
SMAs Are Dominating Right Now
$SOL /USDT has been coiling inside a tight $115 – $123 range. When volatility drops like this, it isn't an accident—it's liquidity compression.
Here is what you need to know before taking your next trade:
1. The "Liquidity Trap" Mechanism
Tight sideways ranges create large clusters of order liquidity:
🟢 Buy Stops: Sitting above $124–$125
🔴 Sell Stops: Sitting below $114–$115
Market makers often sweep these stop clusters to engineer liquidity before picking the real direction. Beware of fakeout wicks!
2. Why SMAs Are Dominating Right Now
In rangebound markets without a macro trend, Simple Moving Averages (SMAs) rule the price action:
Mean Reversion: Flattening 20-day and 50-day SMAs act as magnets pulling price back toward the range midpoint (~$118.50).
Compression Breakout: Watch for the short-term SMA to slope aggressively up or down—that will mark the true breakout initiation.
3. Key Levels to Watch
🚀 Breakout Trigger: Daily close above $124–$125 with expanding volume.
🛡️ Support Floor: Daily close below $114–$115.
🎯 Midpoint Pivot: $118.50 – $119.50 (Controls short-term bias).
💡 Trading Rule
Don't trade the initial wick out of the range. Wait for a candle close confirmation and volume expansion to avoid getting trapped on the wrong side.
What’s your play on $SOL—are we breaking out to $130+ or sweeping $110 first? Let’s hear your thoughts below! 👇
SMAs Are Dominating Right Now
$SOL /USDT has been coiling inside a tight $115 – $123 range. When volatility drops like this, it isn't an accident—it's liquidity compression.
Here is what you need to know before taking your next trade:
1. The "Liquidity Trap" Mechanism
Tight sideways ranges create large clusters of order liquidity:
🟢 Buy Stops: Sitting above $124–$125
🔴 Sell Stops: Sitting below $114–$115
Market makers often sweep these stop clusters to engineer liquidity before picking the real direction. Beware of fakeout wicks!
2. Why SMAs Are Dominating Right Now
In rangebound markets without a macro trend, Simple Moving Averages (SMAs) rule the price action:
Mean Reversion: Flattening 20-day and 50-day SMAs act as magnets pulling price back toward the range midpoint (~$118.50).
Compression Breakout: Watch for the short-term SMA to slope aggressively up or down—that will mark the true breakout initiation.
3. Key Levels to Watch
🚀 Breakout Trigger: Daily close above $124–$125 with expanding volume.
🛡️ Support Floor: Daily close below $114–$115.
🎯 Midpoint Pivot: $118.50 – $119.50 (Controls short-term bias).
💡 Trading Rule
Don't trade the initial wick out of the range. Wait for a candle close confirmation and volume expansion to avoid getting trapped on the wrong side.
What’s your play on $SOL—are we breaking out to $130+ or sweeping $110 first? Let’s hear your thoughts below! 👇