


Three charts on the screen. Three different energies. The first one caught my eye because of a number: 101.66. A high that got sold, and a 1.44% gain on the day that looks like a recovery, not a breakout.
The second chart is the one that made me pause. A 20% candle with an RSI at 89. That's not a drift. That's a decision. The third one is the quietest of the three, but the RSI at 77 says the move is already underway.
$CL is the first one. The funding is negative at -0.0099%. That means shorts are paying longs. On a chart that's been beaten down from 101 to 88, that's the fuel for a squeeze. Open interest sits around $30 million on Binance, and the SuperTrend line at 93.86 is the wall.
The level that matters is $93.86. A clean break above it and the door opens toward $96. Below $88.57 and the bid thins out.
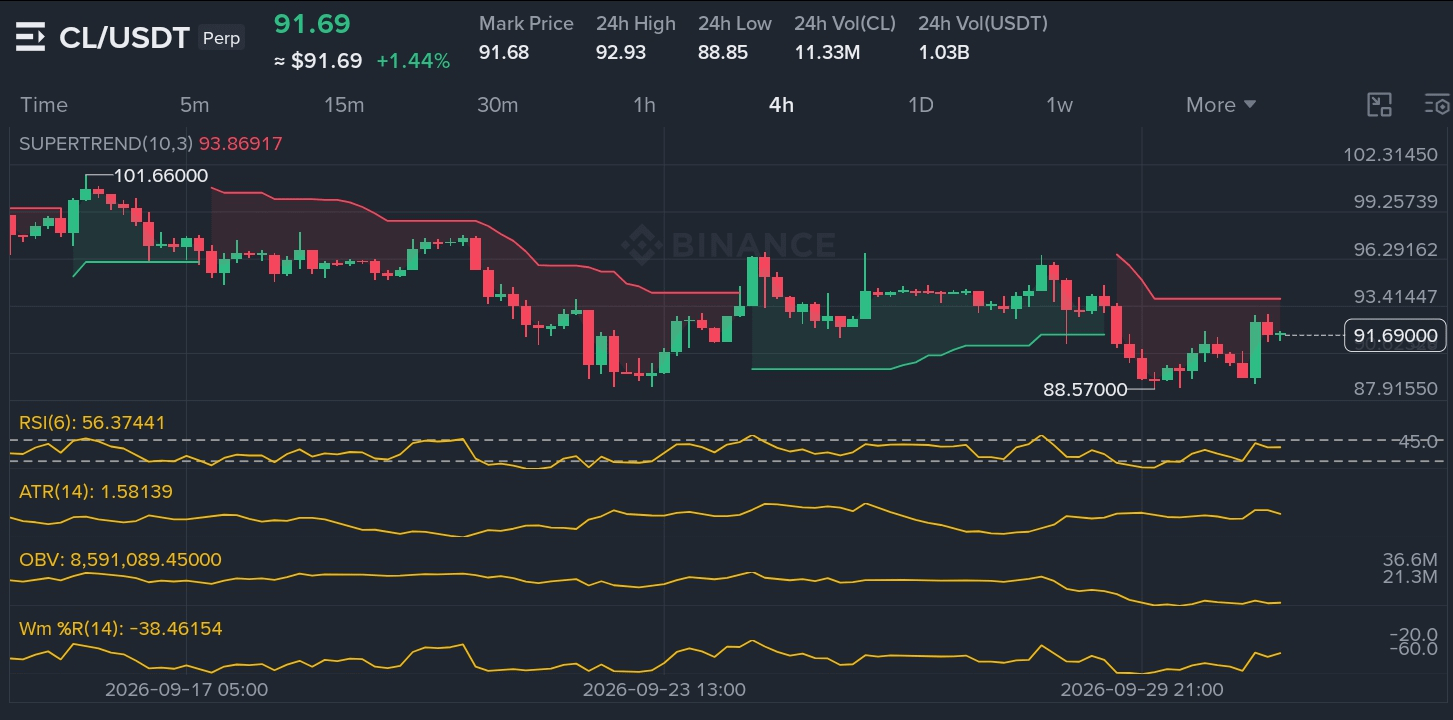
Above $93.86 and I'm watching $96 first, then $99. Lose $88.57 and I'm done. I've held a losing short too long before, watching a small gain turn into a margin call because I believed the trend more than the tape.

$ACN is the second chart. The headline is the Binance listing on September 29. A TradFi perpetual with up to 20x leverage. That's the catalyst. The tape reflects it with a 20% move and volume that's already 115.9% above average.
Funding is positive at 0.0100%. Longs are paying shorts. Open interest is climbing. The SuperTrend at 191.38 is the floor. The level that matters is $219.49. That's the recent high. A clean break above it opens the door toward $240.
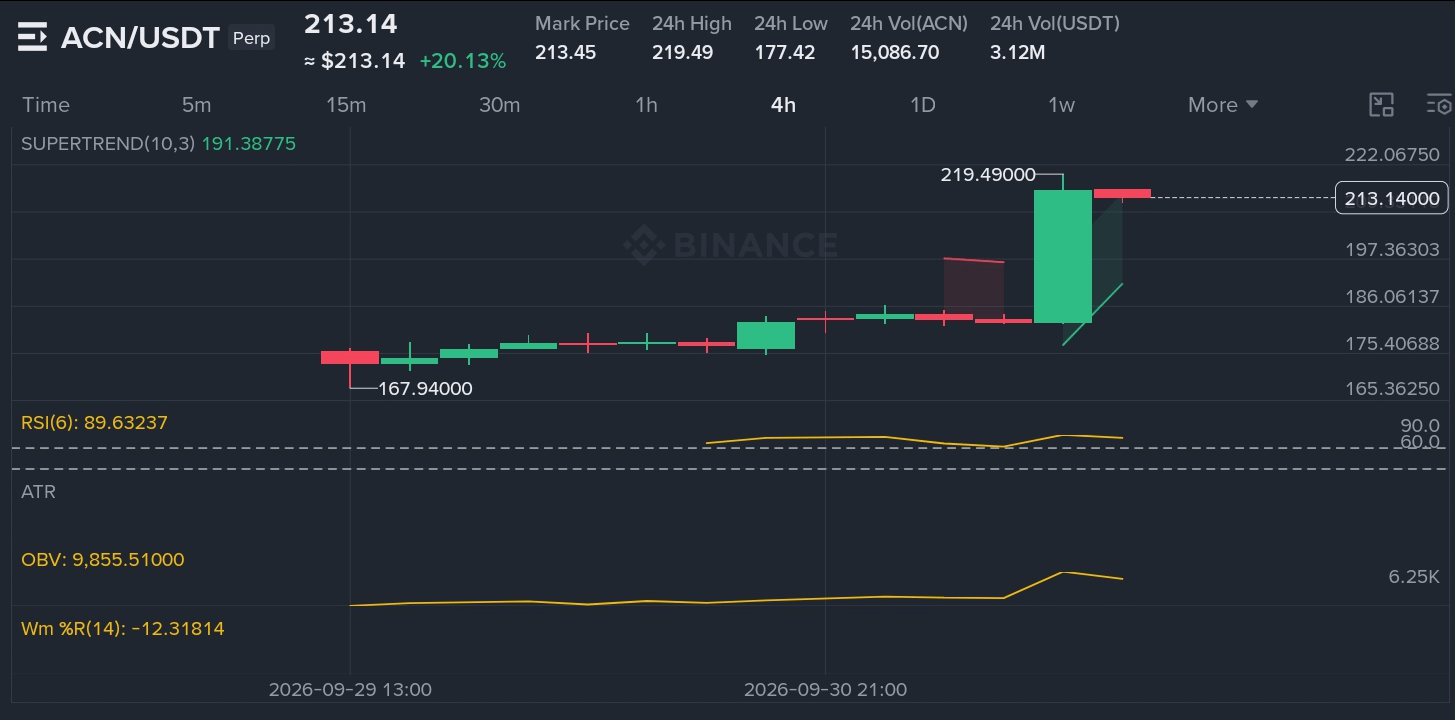
Above $219.49 and I'm watching $240 first, then $260. Lose $177.42 and I'm out.


$NOW is the third chart. The tape is quiet but the RSI at 77 tells a story. The move from 127 to 138 happened fast, and the SuperTrend at 132.82 is now the floor. Funding is near zero on most venues, which means the crowd isn't leaning either way.
Open interest sits around $1.3 million on MEXC. Thin, but climbing. The level that matters is $147.78. That's the recent high. A clean break above it opens the door toward $155.
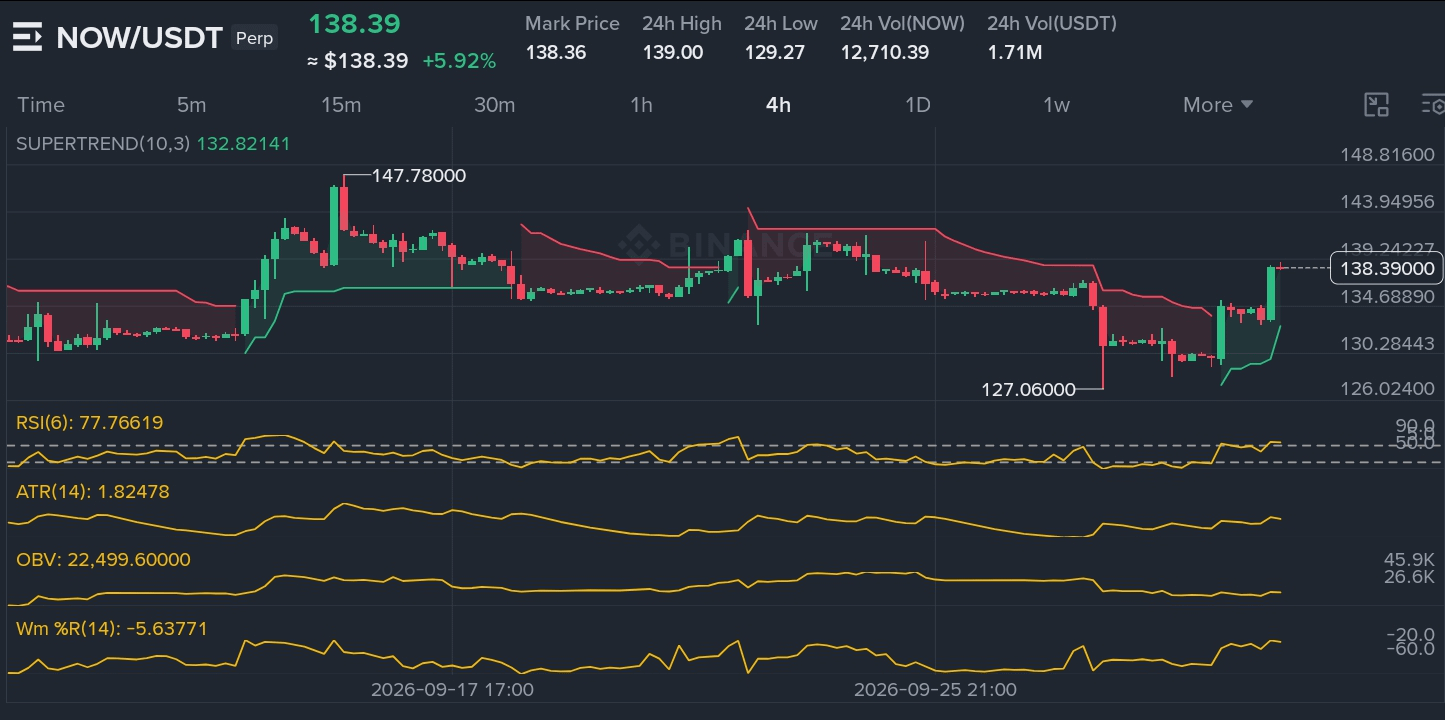
Above $147.78 and I'm watching $155 first, then $165. Lose $127.06 and I'm out.

The wider market matters here. Bitcoin is holding near $84,000 after tapping $87,000. Dominance slipped to 58.6% as of October 1, down 1.11%. That's the spine of this whole trade.
When dominance falls while the aggregate cap rises, the marginal dollar is moving down the risk curve. The Altcoin Season Index is at 64 out of 100. Still below the 75 threshold that confirms a full rotation, but the direction is clear.
Open interest in perpetual futures across crypto is elevated. The crowd is leaning into these TradFi listings and the oil play. Where I could be wrong is if Bitcoin dominance reclaims 60% and the rotation stalls. Then the late longs get paid and these breakouts fail.
I've been on the wrong side of a "confirmed breakout" before. The chart looked perfect, every box checked, and then the bid vanished. That's why I don't trust a wick at the high.
The levels are the levels. The tape will tell you which ones matter.
How much of this rotation did you actually catch, and how much did you watch from the sidelines?