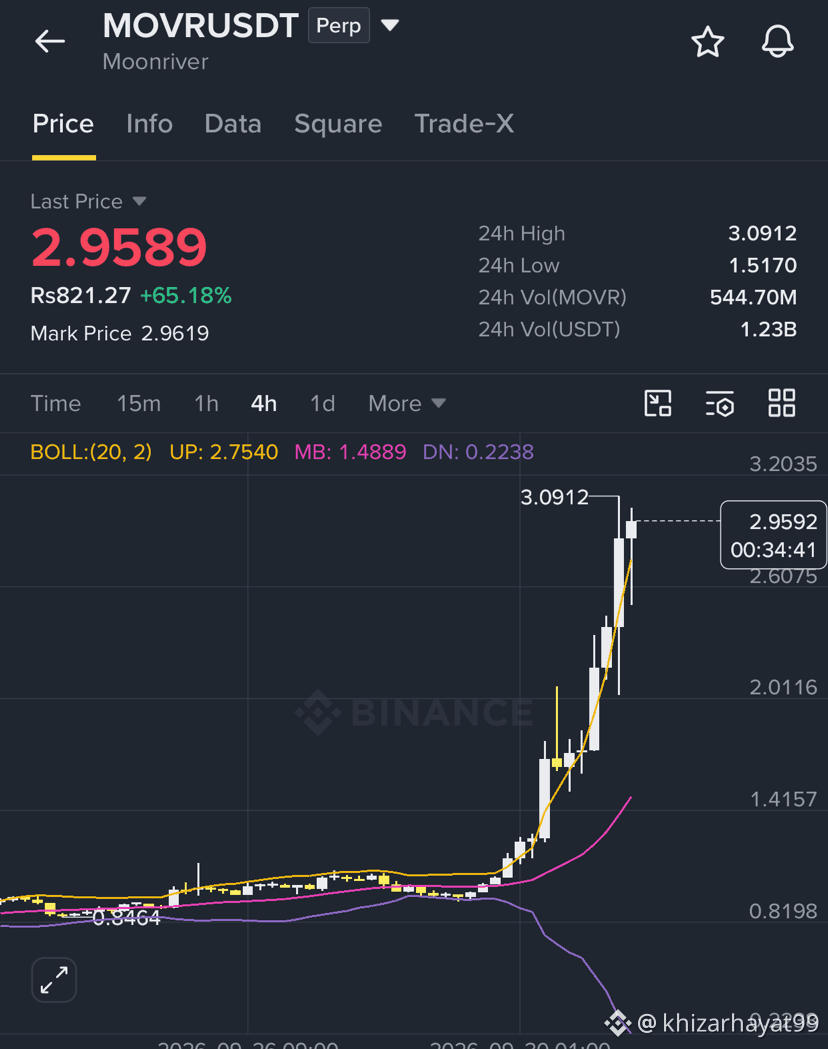
Here is the 4-hour technical analysis structure and trade setup for $MOVR /USDT around the $2.9600 level.
Market Structure & Overview (4-Hour)
At $2.9600, MOVR is trading in a bullish structural expansion. The 4-hour timeframe displays a series of Higher Highs (HH) and Higher Lows (HL) following a breakout above local resistance.
Target 2 : $3.4500 [Major Swing High / Macro Resistance]
Target 1 : $3.1800 [Local Breakout / Liquidity Target]
--------------------------------------------------
Current Price: $2.9600 [Bullish Momentum / Continuous Phase]
--------------------------------------------------
Key Support : $2.8400 [Immediate Order Block / 20 EMA]
Invalidation : $2.6800 [Market Structure Break (MSB) Level]
Technical Indicators Signal
Moving Averages (EMA 20/50/200):
20 EMA (~$2.8400): Acts as immediate dynamic trailing support. Price holding above confirms buyers remain in control.
50 EMA (~$2.7100): Golden cross alignment above the 200 EMA indicates trend strength.
RSI (14-Period):
Floating around 62–66. It shows strong bullish momentum without entering extreme overbought (>70) territory, allowing room for upside continuation.
Volume Profile:
Expanding volume on green candles indicates genuine buying demand supporting the $2.90+ reclaim.
Bullish Long Trade Setup
Entry Strategy:
Aggressive Entry: $2.9200 – $2.9600 (Current level / minor pullback)
Conservative Entry: $2.8400 – $2.8600 (Retest of 20 EMA / Demand Zone)
Take-Profit Targets:
TP 1: $3.1800 (+8.1%) — Partial take-profit & trail stop to breakeven
TP 2: $3.4500 (+17.2%) — Major key resistance
Stop Loss / Invalidation:
Stop Loss: $2.6800 (-9.2%)
Reasoning: A 4-hour candle close below $2.6800 invalidates the bullish market structure and flips momentum back to the downside.
Execution Summary
The bullish market structure remains intact as long as MOVR holds above the $2.8400 support area. Watch for a clean 4-hour push toward $3.1800 to confirm the next leg of expansion.
Market Structure & Overview (4-Hour)
At $2.9600, MOVR is trading in a bullish structural expansion. The 4-hour timeframe displays a series of Higher Highs (HH) and Higher Lows (HL) following a breakout above local resistance.
Target 2 : $3.4500 [Major Swing High / Macro Resistance]
Target 1 : $3.1800 [Local Breakout / Liquidity Target]
--------------------------------------------------
Current Price: $2.9600 [Bullish Momentum / Continuous Phase]
--------------------------------------------------
Key Support : $2.8400 [Immediate Order Block / 20 EMA]
Invalidation : $2.6800 [Market Structure Break (MSB) Level]
Technical Indicators Signal
Moving Averages (EMA 20/50/200):
20 EMA (~$2.8400): Acts as immediate dynamic trailing support. Price holding above confirms buyers remain in control.
50 EMA (~$2.7100): Golden cross alignment above the 200 EMA indicates trend strength.
RSI (14-Period):
Floating around 62–66. It shows strong bullish momentum without entering extreme overbought (>70) territory, allowing room for upside continuation.
Volume Profile:
Expanding volume on green candles indicates genuine buying demand supporting the $2.90+ reclaim.
Bullish Long Trade Setup
Entry Strategy:
Aggressive Entry: $2.9200 – $2.9600 (Current level / minor pullback)
Conservative Entry: $2.8400 – $2.8600 (Retest of 20 EMA / Demand Zone)
Take-Profit Targets:
TP 1: $3.1800 (+8.1%) — Partial take-profit & trail stop to breakeven
TP 2: $3.4500 (+17.2%) — Major key resistance
Stop Loss / Invalidation:
Stop Loss: $2.6800 (-9.2%)
Reasoning: A 4-hour candle close below $2.6800 invalidates the bullish market structure and flips momentum back to the downside.
Execution Summary
The bullish market structure remains intact as long as MOVR holds above the $2.8400 support area. Watch for a clean 4-hour push toward $3.1800 to confirm the next leg of expansion.