$NOM
/USDT
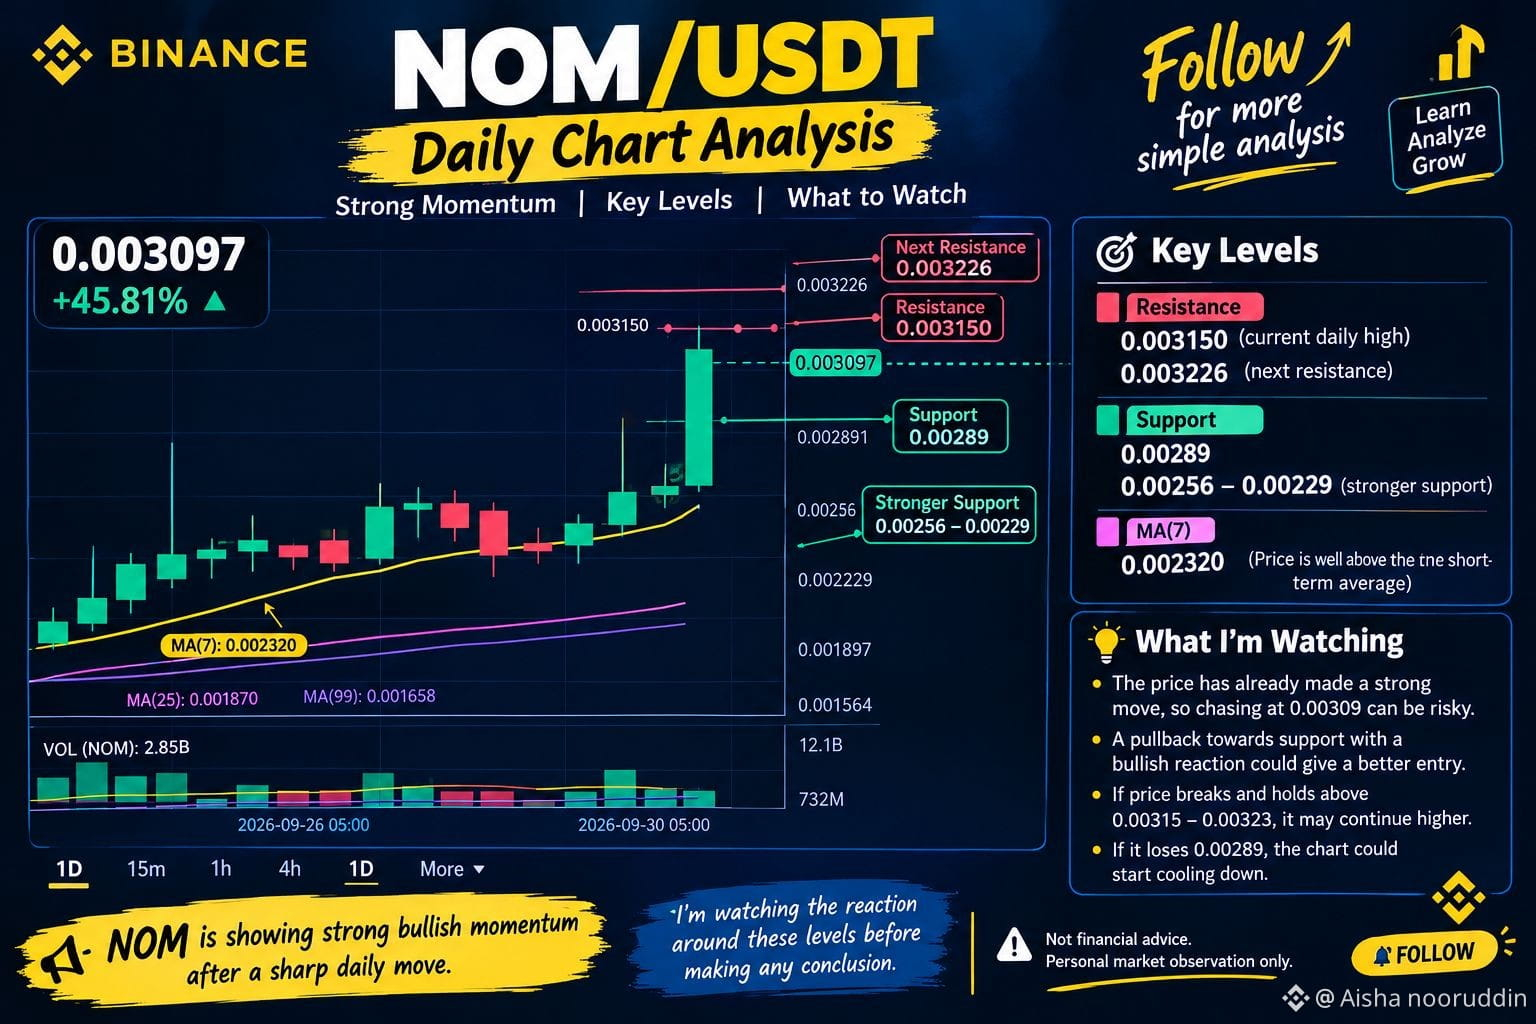
$NOM is showing strong bullish momentum on the 1D chart. The price is around 0.003097, up about 45.8%, after a large green daily candle.
Key levels from this chart:
🔴 Resistance: 0.003150 — current daily high
🔴 Next resistance: 0.003226
🟢 Support: 0.00289
🟢 Stronger support: 0.00256–0.00229
MA(7): 0.002320, so price is currently well above the short-term average.
What I would watch
Because the move has already been very strong, chasing the price at 0.00309 can be risky. A pullback toward support followed by a bullish reaction would give a clearer setup.
$NOM is showing strong bullish momentum after a sharp daily move.
Resistance: 0.00315–0.00323
Support: 0.00289 / 0.00256
The key now is whether buyers can maintain momentum or whether price pulls back to test support.
I’m watching the reaction around these levels before making any conclusion.
Not financial advice. Personal market observation only.
★Follow for more simple chart analysis
/USDT
$NOM is showing strong bullish momentum on the 1D chart. The price is around 0.003097, up about 45.8%, after a large green daily candle.
Key levels from this chart:
🔴 Resistance: 0.003150 — current daily high
🔴 Next resistance: 0.003226
🟢 Support: 0.00289
🟢 Stronger support: 0.00256–0.00229
MA(7): 0.002320, so price is currently well above the short-term average.
What I would watch
Because the move has already been very strong, chasing the price at 0.00309 can be risky. A pullback toward support followed by a bullish reaction would give a clearer setup.
$NOM is showing strong bullish momentum after a sharp daily move.
Resistance: 0.00315–0.00323
Support: 0.00289 / 0.00256
The key now is whether buyers can maintain momentum or whether price pulls back to test support.
I’m watching the reaction around these levels before making any conclusion.
Not financial advice. Personal market observation only.
★Follow for more simple chart analysis