$US
USDT – 15M Chart Analysis
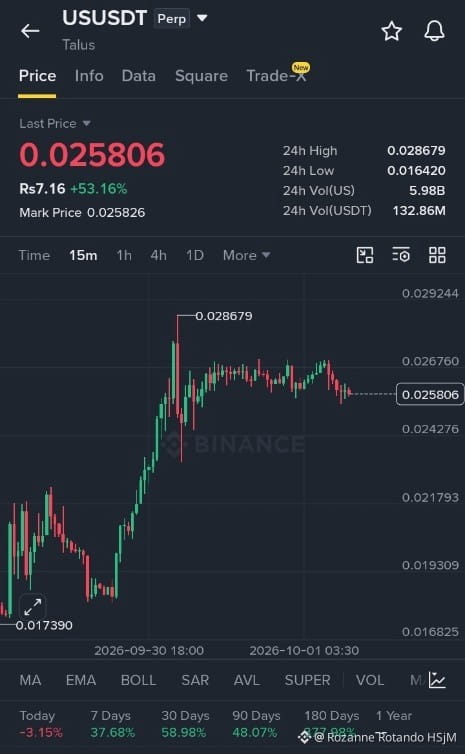
Current Price: 0.025806 USDT
The chart shows a strong bullish rally from 0.017390 to 0.028679, followed by sideways consolidation. The latest candles indicate selling pressure near the upper range.
### Key Levels
| Level | Price |
| ---------------- | ------- |
| Resistance 1 | 0.02670 |
| Resistance 2 | 0.02760 |
| Major Resistance | 0.02868 |
| Support 1 | 0.02500 |
| Support 2 | 0.02430 |
| Major Support | 0.02280 |
### Potential Long Setup
LONG – Wait for confirmation
Bullish scenario
Entry zone
### 0.02480 – 0.02520
Stop Loss
0.02400
Target 1
0.02670
Target 2
0.02760
Target 3
0.02860
### Alternative Scenario
$MOVR
If price breaks below 0.02430 with strong selling volume, the bullish setup weakens, and a deeper correction toward 0.02280 becomes possible.
My observation: Avoid chasing the current price. Wait for a 15-minute candle to confirm support or a breakout above 0.02670 before entering. These are technical scenarios, not guaranteed outcomes. Use strict risk management, especially with leveraged futures.
USDT – 15M Chart Analysis
Current Price: 0.025806 USDT
The chart shows a strong bullish rally from 0.017390 to 0.028679, followed by sideways consolidation. The latest candles indicate selling pressure near the upper range.
### Key Levels
| Level | Price |
| ---------------- | ------- |
| Resistance 1 | 0.02670 |
| Resistance 2 | 0.02760 |
| Major Resistance | 0.02868 |
| Support 1 | 0.02500 |
| Support 2 | 0.02430 |
| Major Support | 0.02280 |
### Potential Long Setup
LONG – Wait for confirmation
Bullish scenario
Entry zone
### 0.02480 – 0.02520
Stop Loss
0.02400
Target 1
0.02670
Target 2
0.02760
Target 3
0.02860
### Alternative Scenario
$MOVR
If price breaks below 0.02430 with strong selling volume, the bullish setup weakens, and a deeper correction toward 0.02280 becomes possible.
My observation: Avoid chasing the current price. Wait for a 15-minute candle to confirm support or a breakout above 0.02670 before entering. These are technical scenarios, not guaranteed outcomes. Use strict risk management, especially with leveraged futures.