$PEPE
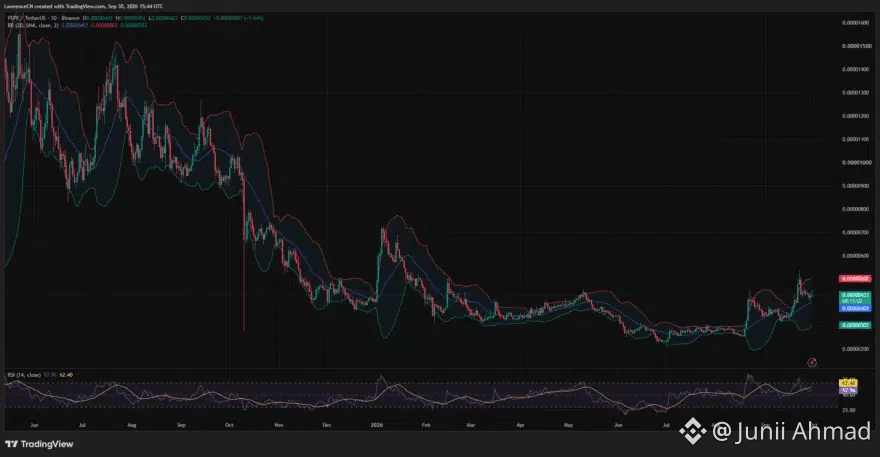
price has held above $0.000004 as its September rally cools, with improving weekly momentum facing a bearish short-term setup near $0.0000041. TradingView’s Binance PEPE/USDT daily chart showed the token at $0.00000433 on Sep. 30, up 1.64% from the daily opening price. The session ranged between $0.00000423 and $0.00000452, with PEPE retreating from the upper end of that range.
The token remained below its September spike above $0.0000053. At $0.00000433, PEPE was roughly 18% below that level, although it continued to trade above the area around $0.0000035 where it spent part of the month before the rally.
PEPE holds above its $0.00000402 daily midpoint
On the daily chart, PEPE traded above the 20-day Bollinger midpoint at $0.00000402. The upper band stood at $0.00000502, while the lower band was at $0.00000302.The price was roughly 7.7% above the midpoint and 13.7% below the upper band. A return to $0.00000502 would require a gain of about 16% from the daily chart’s price, before another test of the September peak.
Daily relative strength also remained above its neutral threshold. The 14-day RSI stood at 57.96, below its moving average of 62.40 and below the overbought readings reached during the recent surge.#BitcoinClears$85200 #QNTRises287% #TrumpRejectsAIRulesForVoluntaryAudits #PEPE
price has held above $0.000004 as its September rally cools, with improving weekly momentum facing a bearish short-term setup near $0.0000041. TradingView’s Binance PEPE/USDT daily chart showed the token at $0.00000433 on Sep. 30, up 1.64% from the daily opening price. The session ranged between $0.00000423 and $0.00000452, with PEPE retreating from the upper end of that range.
The token remained below its September spike above $0.0000053. At $0.00000433, PEPE was roughly 18% below that level, although it continued to trade above the area around $0.0000035 where it spent part of the month before the rally.
PEPE holds above its $0.00000402 daily midpoint
On the daily chart, PEPE traded above the 20-day Bollinger midpoint at $0.00000402. The upper band stood at $0.00000502, while the lower band was at $0.00000302.The price was roughly 7.7% above the midpoint and 13.7% below the upper band. A return to $0.00000502 would require a gain of about 16% from the daily chart’s price, before another test of the September peak.
Daily relative strength also remained above its neutral threshold. The 14-day RSI stood at 57.96, below its moving average of 62.40 and below the overbought readings reached during the recent surge.#BitcoinClears$85200 #QNTRises287% #TrumpRejectsAIRulesForVoluntaryAudits #PEPE