DAILY MARKET SIGNAL — SOL/USDT
📊 Market Structure
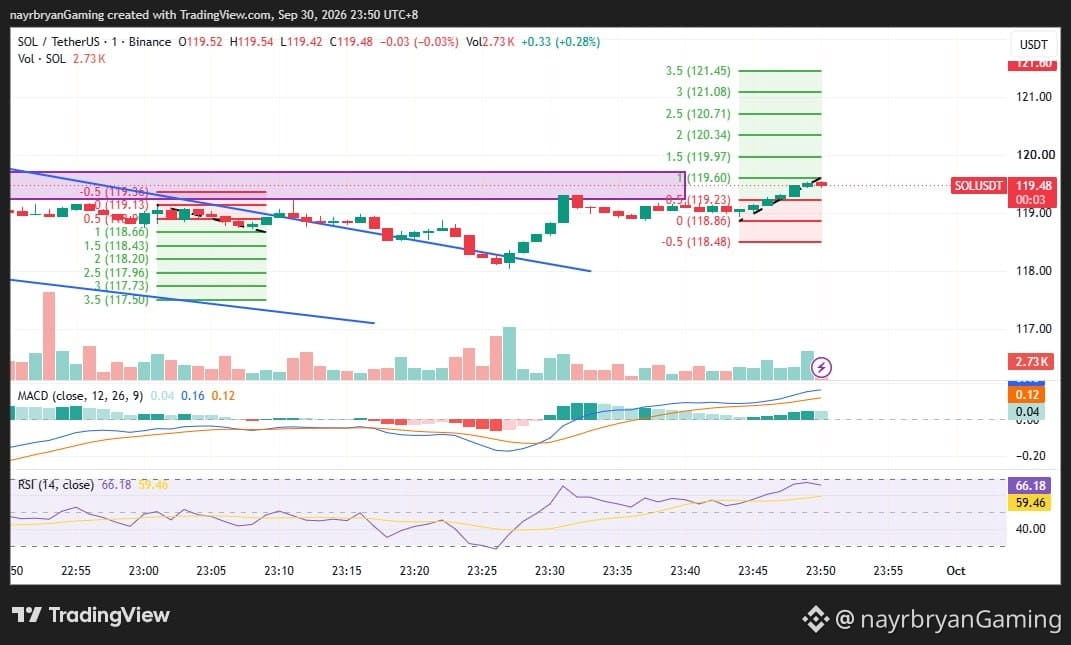
SOL has recovered from the 118.48–118.66 area and pushed back above the previous consolidation zone.
Price is now trading around 119.55, directly below the 119.60 Fib 1 level.
The short-term structure has improved, with higher lows developing along the rising support line.
The immediate question is whether SOL can break and hold above 119.60.
🔹 Key Levels
Current Price
119.55
Support / Reaction Zone
118.66–119.23
Fib 0
118.66
Fib 0.5
119.23
Breakout / Fib 1
119.60
Fib 1.5
119.97
Fib 2
120.34
Fib 2.5
120.71
Fib 3
121.08
Fib 3.5
121.45
Lower Invalidation Reference
118.48
📈 Bullish Scenario
If SOL breaks above 119.60 and holds the level on a retest, the next Fibonacci expansion areas are:
119.97 → 120.34 → 120.71 → 121.08 → 121.45
A sustained move above the nearby descending/overhead resistance would provide stronger confirmation of the recovery.
📉 Rejection Scenario
If SOL fails to hold above 119.60, price could rotate back toward:
119.23 → 118.66
A loss of 118.66 would weaken the current recovery structure.
Below 118.48, the bullish setup would be significantly weakened.
📊 Indicator Check
RSI: 68.01
Momentum is clearly stronger than in the previous chart, but RSI is approaching the traditionally elevated zone.
That means momentum is strong, but chasing becomes increasingly risky.
MACD: Positive.
MACD supports the current recovery momentum.
Still, price confirmation remains the primary signal.
🧠 Bottom Line
SOL has recovered strongly and is now testing 119.60.
119.60 is the key decision level.
Break + hold → expansion scenario.
Rejection → pullback toward 119.23 / 118.66 remains possible.
Momentum is strong.
Confirmation still matters.
DYOR / NFA.
— @nayrbryanGaming
#SOL #SOLUSDT #Crypto #TechnicalAnalysis #DYOR #NFA
📊 Market Structure
SOL has recovered from the 118.48–118.66 area and pushed back above the previous consolidation zone.
Price is now trading around 119.55, directly below the 119.60 Fib 1 level.
The short-term structure has improved, with higher lows developing along the rising support line.
The immediate question is whether SOL can break and hold above 119.60.
🔹 Key Levels
Current Price
119.55
Support / Reaction Zone
118.66–119.23
Fib 0
118.66
Fib 0.5
119.23
Breakout / Fib 1
119.60
Fib 1.5
119.97
Fib 2
120.34
Fib 2.5
120.71
Fib 3
121.08
Fib 3.5
121.45
Lower Invalidation Reference
118.48
📈 Bullish Scenario
If SOL breaks above 119.60 and holds the level on a retest, the next Fibonacci expansion areas are:
119.97 → 120.34 → 120.71 → 121.08 → 121.45
A sustained move above the nearby descending/overhead resistance would provide stronger confirmation of the recovery.
📉 Rejection Scenario
If SOL fails to hold above 119.60, price could rotate back toward:
119.23 → 118.66
A loss of 118.66 would weaken the current recovery structure.
Below 118.48, the bullish setup would be significantly weakened.
📊 Indicator Check
RSI: 68.01
Momentum is clearly stronger than in the previous chart, but RSI is approaching the traditionally elevated zone.
That means momentum is strong, but chasing becomes increasingly risky.
MACD: Positive.
MACD supports the current recovery momentum.
Still, price confirmation remains the primary signal.
🧠 Bottom Line
SOL has recovered strongly and is now testing 119.60.
119.60 is the key decision level.
Break + hold → expansion scenario.
Rejection → pullback toward 119.23 / 118.66 remains possible.
Momentum is strong.
Confirmation still matters.
DYOR / NFA.
— @nayrbryanGaming
#SOL #SOLUSDT #Crypto #TechnicalAnalysis #DYOR #NFA