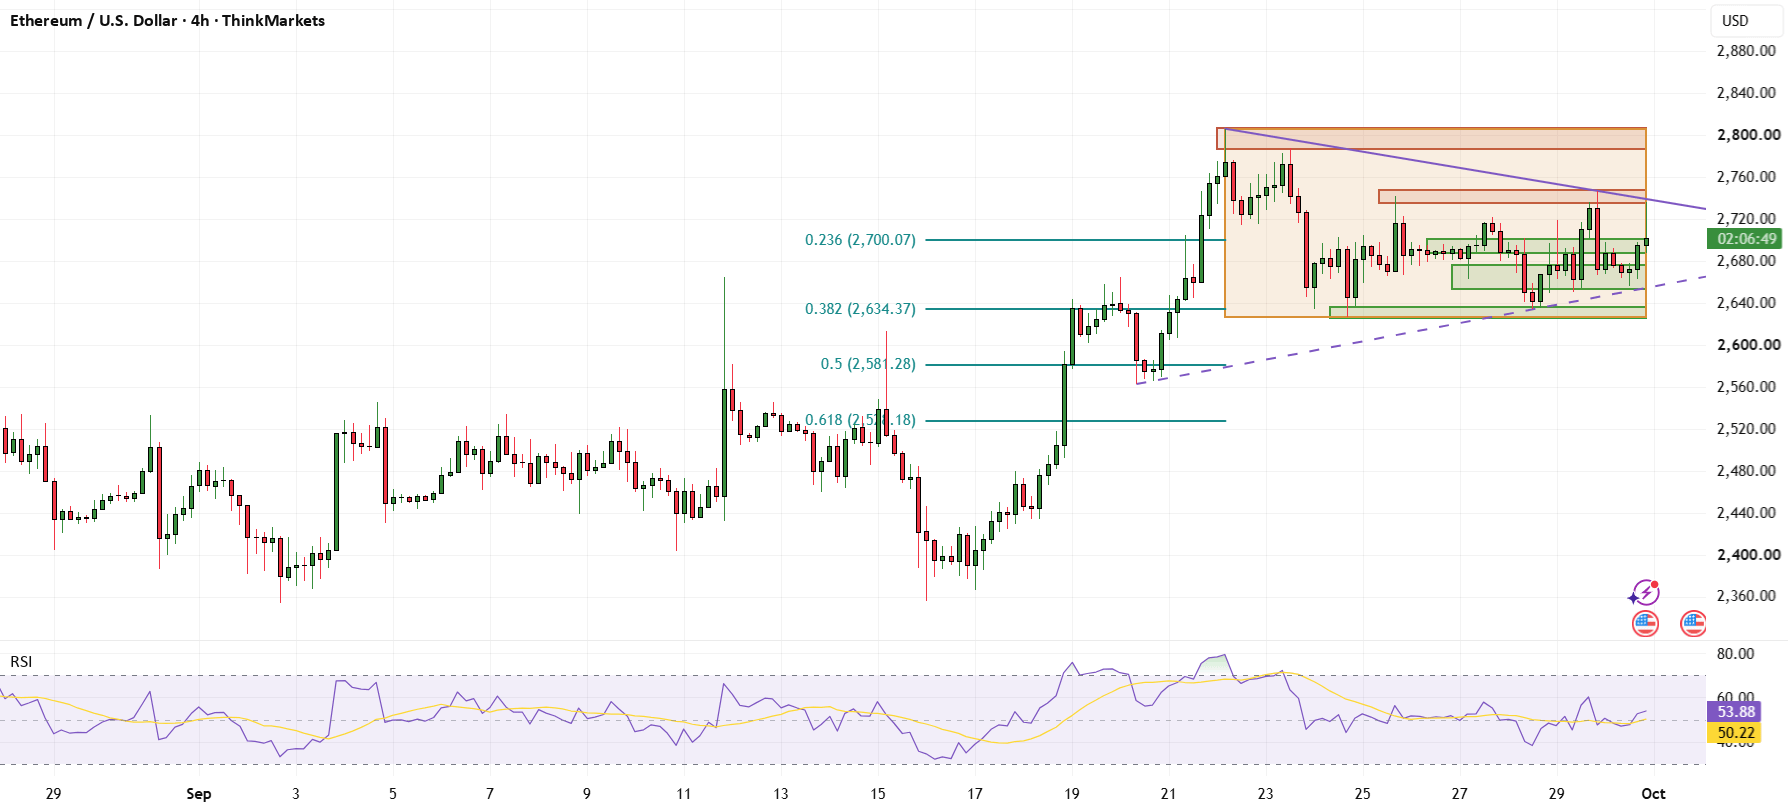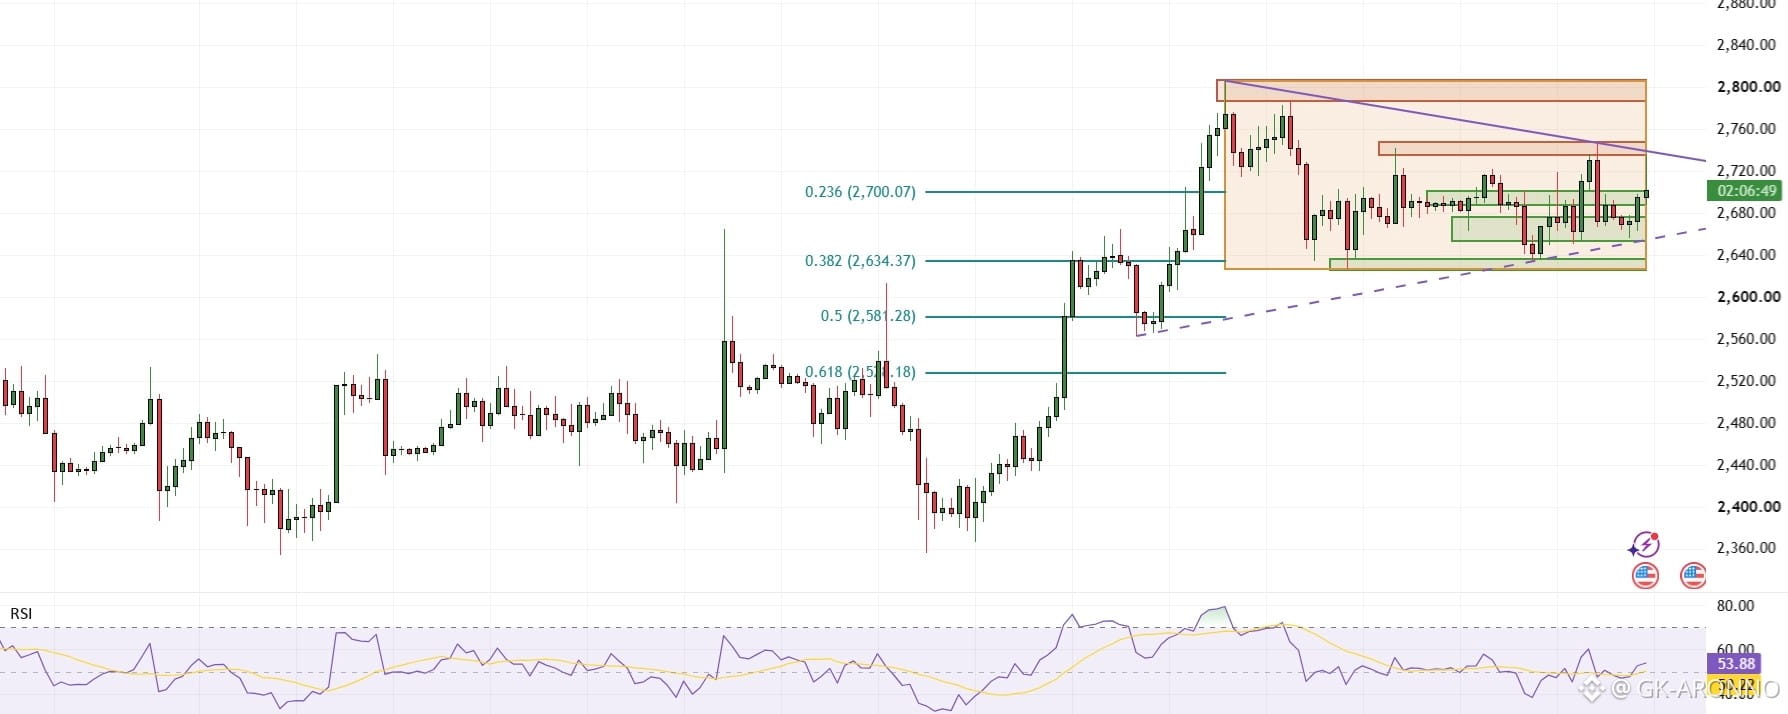


Ethereum rallied about 450 points between 15 and 21 September. The nine days since have not been quiet, price has travelled 179.52 points from the high to the 24 September low, but each swing has been smaller than the last and the space left is now 85 points wide.
Price is 2,734.73 on the ThinkMarkets feed, up 1.43% on the session, with the live candle reaching 2,735.70. The line that has capped every high since 21 September sits four dollars above that.
The two lines that matter
The upper boundary runs from the 21 September high at 2,806.27 through the 29 September high at 2,747.11, falls about eight points a day, and is worth 2,739.4 at this candle. No high has printed above it.
The lower one rises from the 20 September low at 2,562.98 through the 28 September low at 2,634.13, gains about nine points a day, and is worth 2,654.5. No low has printed below it. Each has two anchors, so read them as developing reference lines, but the geometry is clean: the gap between them is 85 points against a 35 point average true range, and it closes by about 17 points a day.
The support that keeps appearing
2,626 to 2,636 is the most crowded ten points on this chart. Using a provisional Fibonacci measurement of the 15 to 21 September advance, it holds the 24 September low at 2,626.75, the 28 September low at 2,634.13, the 100 EMA at 2,631.41 and the 38.2% retracement at 2,634.37. Four separate references, and the 28 September low undercut the retracement by 0.24 points before turning.
Above it, 2,654 to 2,676 carries the rising boundary and the 50 EMA at 2,675.53, and 2,688 to 2,701 holds the 20 EMA at 2,688.79 with the provisional 23.6% retracement at 2,700.07, which price reclaimed this morning. All four moving averages sit beneath price, which makes them potential dynamic support references rather than confirmed support until price interacts with them again.
Overhead, 2,735 to 2,748 contains today's high, the 29 September high and the upper boundary. Then 2,787 to 2,807, where the 23 September high and the September peak sit.
Momentum
RSI is 59.6 against its own average at 50.6. Checked by hand, the last two lows at 2,634.13 on 28 September and 2,655.94 this morning came with higher readings each time, so momentum agrees with price rather than warning about it, and there is no divergence to lean on. The four moving averages are in bullish order beneath price at 2,688.79, 2,675.53, 2,631.41 and 2,531.03.
Scenarios
● Bullish: A four-hour close above the descending reference boundary, currently near 2,739.4, is the first indication of an upside break. Because that boundary runs through the 2,735 to 2,748 resistance band, a close above 2,748 clears the whole zone and is the stronger confirmation, leaving 2,787 to 2,807 as the next test. The boundary value moves as each candle forms.
● Bearish: A four-hour close below 2,688 loses the first support zone and puts price beneath the 20 EMA, the first deterioration in the recovery. The 2,654 to 2,676 zone is then the next test, holding the 50 EMA and the rising boundary. A close below roughly 2,654 breaks both and is the stronger confirmation, exposing 2,626 to 2,636, with the provisional 50% retracement at 2,581.28 as the deeper measured reference beneath it.
● No confirmation: Four-hour closes between the two developing boundaries, currently near 2,654.5 and 2,739.4, leave Ethereum inside the compression. Closes inside 2,735 to 2,748 but below the descending boundary are resistance testing rather than a structural break, and a close above the boundary but below 2,748 is an initial break without full clearance of the zone. Both boundary values should be refreshed as new candles form.
What this tells us
A developing converging structure is a framework for watching the distance between two boundaries narrow. It does not predict the timing or the direction of the next confirmed break, and what it gives you instead is two prices that are easier to define than any opinion about direction.
The gap between the boundaries is now about 85 points, roughly 2.4 current four-hour ATRs. That shows how much the available space has narrowed against recent volatility; it says nothing about when or which way the break comes. So: does the side that has held every high since the peak give way first, or the one that has held every low?
Any opinions, news, research, analyses, prices or other information contained on this website is provided as general market commentary and does not constitute investment advice. ThinkMarkets will not accept liability for any loss or damage including, without limitation, to any loss of profit which may arise directly or indirectly from use of or reliance on such information.