QNTUSDT 4H — Strong Technical Analysis
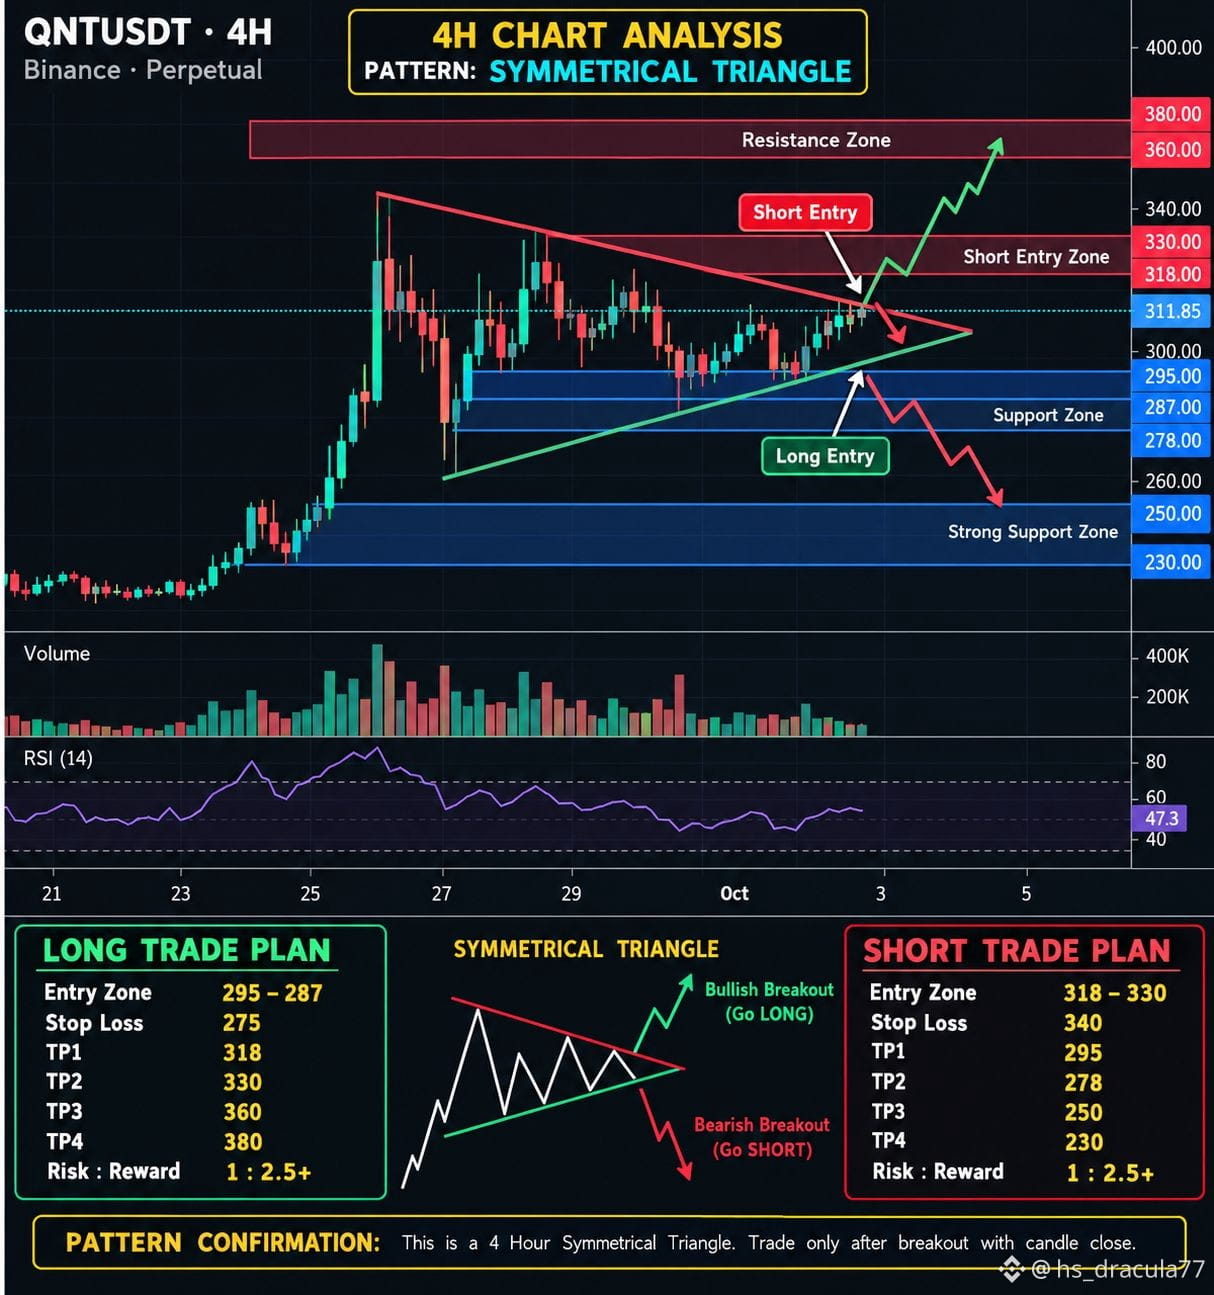
Based on the 4H chart you provided, $QNT is forming a Symmetrical Triangle after a strong impulsive move upward.
Price is currently around $311.85, approaching the triangle’s apex, so volatility expansion could be close. The key point is that the breakout direction needs confirmation rather than entering in the middle of the pattern.
🔺 Pattern Structure
Pattern: 4H Symmetrical Triangle
Current price: ~$311.85
Upper resistance: $318 → $330
Major resistance: $360–$380
First support: $295
Key support: $287
Lower support: $278
Major downside support: $250–$230
🟢 Bullish Scenario
A clean 4H candle close above $318, followed by a successful retest, would strengthen the bullish breakout setup.
Potential levels:
Entry: $318–$322 after confirmation/retest
TP1: $330
TP2: $360
TP3: $380
Invalidation: sustained move back below the breakout area
A breakout above $330 with strong volume would provide stronger confirmation of continuation toward the higher resistance zone.
🔴 Bearish Scenario
If $QNT loses the lower triangle support and gets a 4H close below $295, the structure becomes bearish.
Confirmation improves below $287.
Potential downside levels:
TP1: $287
TP2: $278
TP3: $250
Extended support: $230
⚠️ Important
At $311–312, price is sitting inside the pattern—not at an ideal confirmation point. Chasing a trade here carries higher false-breakout risk.
My chart-based plan:
Wait for the triangle to break.
Above $318/$330 → bullish confirmation.
Below $295/$287 → bearish confirmation.
Volume should expand with the breakout; a breakout with weak volume has a higher chance of being a fakeout.
---
📌 Binance Square Post — Copy/Paste
QNTUSDT 4H Technical Analysis 🔥
$QNT is currently forming a 4H Symmetrical Triangle after a strong upward move.
Price is trading around $311.85, very close to the triangle apex, which means a volatility expansion could be approaching.
🔵 Key Resistance:
$318 → $330
#QNTUSDT #QNTUSDT #Crypto
Based on the 4H chart you provided, $QNT is forming a Symmetrical Triangle after a strong impulsive move upward.
Price is currently around $311.85, approaching the triangle’s apex, so volatility expansion could be close. The key point is that the breakout direction needs confirmation rather than entering in the middle of the pattern.
🔺 Pattern Structure
Pattern: 4H Symmetrical Triangle
Current price: ~$311.85
Upper resistance: $318 → $330
Major resistance: $360–$380
First support: $295
Key support: $287
Lower support: $278
Major downside support: $250–$230
🟢 Bullish Scenario
A clean 4H candle close above $318, followed by a successful retest, would strengthen the bullish breakout setup.
Potential levels:
Entry: $318–$322 after confirmation/retest
TP1: $330
TP2: $360
TP3: $380
Invalidation: sustained move back below the breakout area
A breakout above $330 with strong volume would provide stronger confirmation of continuation toward the higher resistance zone.
🔴 Bearish Scenario
If $QNT loses the lower triangle support and gets a 4H close below $295, the structure becomes bearish.
Confirmation improves below $287.
Potential downside levels:
TP1: $287
TP2: $278
TP3: $250
Extended support: $230
⚠️ Important
At $311–312, price is sitting inside the pattern—not at an ideal confirmation point. Chasing a trade here carries higher false-breakout risk.
My chart-based plan:
Wait for the triangle to break.
Above $318/$330 → bullish confirmation.
Below $295/$287 → bearish confirmation.
Volume should expand with the breakout; a breakout with weak volume has a higher chance of being a fakeout.
---
📌 Binance Square Post — Copy/Paste
QNTUSDT 4H Technical Analysis 🔥
$QNT is currently forming a 4H Symmetrical Triangle after a strong upward move.
Price is trading around $311.85, very close to the triangle apex, which means a volatility expansion could be approaching.
🔵 Key Resistance:
$318 → $330
#QNTUSDT #QNTUSDT #Crypto