#ZECUSDT
Chart Breakdown & Key Indicators
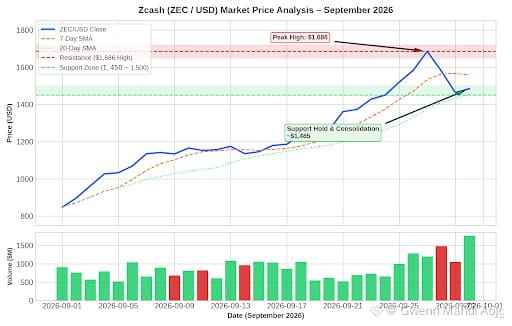
Primary Trend: ZEC experienced a strong parabolic expansion through September 2026, rallying from $848 to a peak high of $1,686.
Current Consolidation: Following a leverage reset and profit-taking across derivative markets, price retraced to establish immediate technical support around $1,450 – $1,500.
Moving Averages: Price remains above both the 7-day and 20-day Simple Moving Averages (SMAs), signaling that the macro upward trend structure remains intact despite short-term volatility.
Volume Dynamics: Trading volume spiked sharply during the test of resistance near $1,686 and has normalized into the support floor, indicating healthy absorption by spot buyers.
Key Technical Levels
$ZEC
Chart Breakdown & Key Indicators
Primary Trend: ZEC experienced a strong parabolic expansion through September 2026, rallying from $848 to a peak high of $1,686.
Current Consolidation: Following a leverage reset and profit-taking across derivative markets, price retraced to establish immediate technical support around $1,450 – $1,500.
Moving Averages: Price remains above both the 7-day and 20-day Simple Moving Averages (SMAs), signaling that the macro upward trend structure remains intact despite short-term volatility.
Volume Dynamics: Trading volume spiked sharply during the test of resistance near $1,686 and has normalized into the support floor, indicating healthy absorption by spot buyers.
Key Technical Levels
$ZEC