$ZEC / USDT DAILY CHART ANALYSIS & SHORT POSITION UPDATE 📉🔥
Guys, looking at the 1D chart and current position, the market is looking very risky right now. Here’s the full technical breakdown and position update:
Chart Technical Analysis:
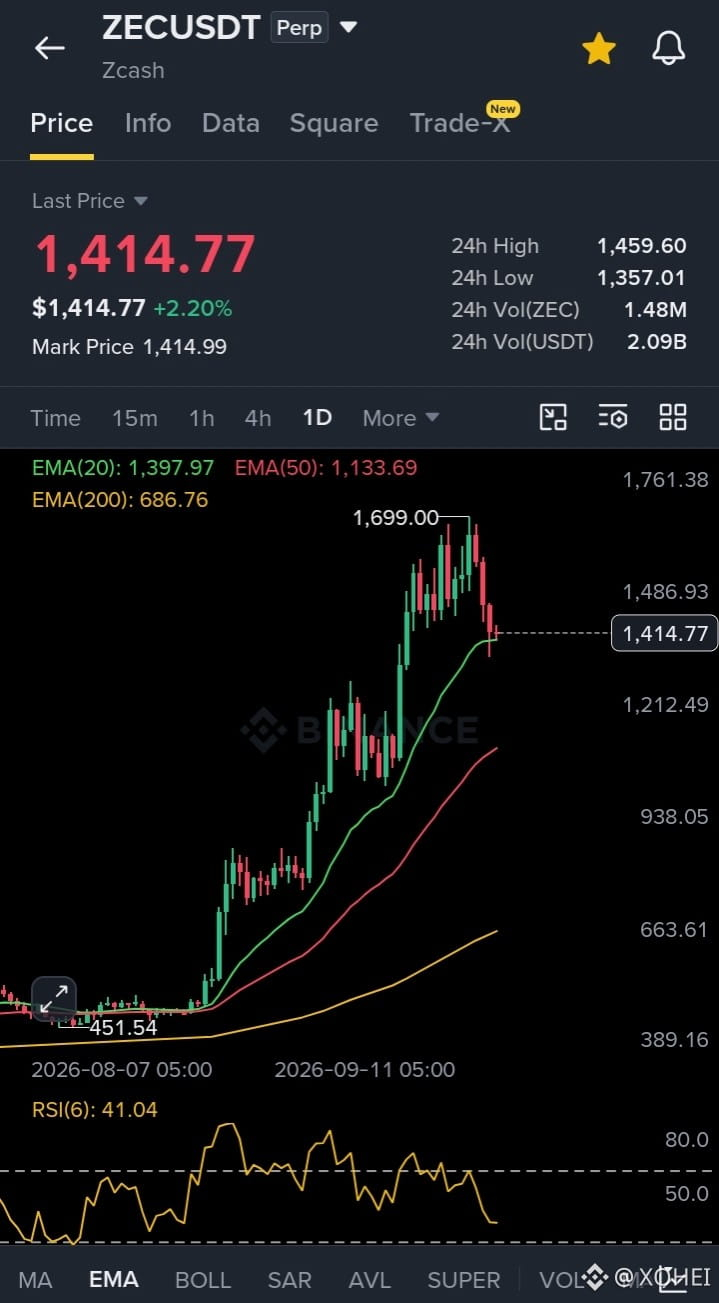
• EMA Crossover & Support Test: On the daily chart, price rejected from the $1,699 top and moved lower. It’s now testing support around the EMA 20 ($1,397.97).
• RSI Cool-off: RSI(6) has dropped to 41.04, showing that buying momentum has weakened and a short-term correction is underway.
• Macro Trend & Target: As long as price holds above $1,133 (EMA 50), the bigger trend remains bullish. But if selling pressure continues, the $800 zone could come into play after a major breakdown.
Current Short Position Status (Cross 50x):
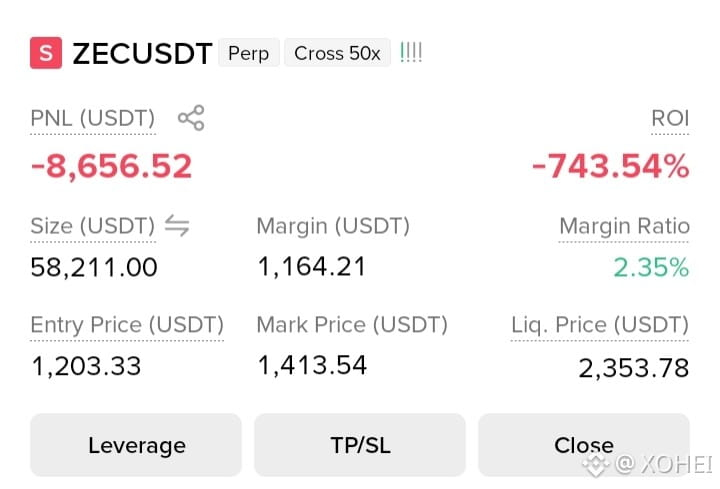
• Entry Price: $1,203.33
• Mark Price: ~$1,413.54
• Liquidation Price: $2,353.78
• PNL / Status: The position is currently in loss because price is trading above the entry. With 50x leverage, the pressure on the margin is much higher.
With high-leverage trades, risk management comes first. Keep a close eye on your margin and liquidation buffer
Guys, looking at the 1D chart and current position, the market is looking very risky right now. Here’s the full technical breakdown and position update:
Chart Technical Analysis:
• EMA Crossover & Support Test: On the daily chart, price rejected from the $1,699 top and moved lower. It’s now testing support around the EMA 20 ($1,397.97).
• RSI Cool-off: RSI(6) has dropped to 41.04, showing that buying momentum has weakened and a short-term correction is underway.
• Macro Trend & Target: As long as price holds above $1,133 (EMA 50), the bigger trend remains bullish. But if selling pressure continues, the $800 zone could come into play after a major breakdown.
Current Short Position Status (Cross 50x):
• Entry Price: $1,203.33
• Mark Price: ~$1,413.54
• Liquidation Price: $2,353.78
• PNL / Status: The position is currently in loss because price is trading above the entry. With 50x leverage, the pressure on the margin is much higher.
With high-leverage trades, risk management comes first. Keep a close eye on your margin and liquidation buffer