$HBAR 's Rally Fizzles Out Momentum Fading After the Spike
Pair: $HBAR /USDT
Direction: SHORT
Leverage: 5x
Entry Zone: 0.1180 – 0.1188
Take Profit:
- TP1: 0.11195 +19%
- TP2: 0.10768 +28%
- TP3: 0.10128 +43%
Stop Loss: 0.12690
Chart Structure:
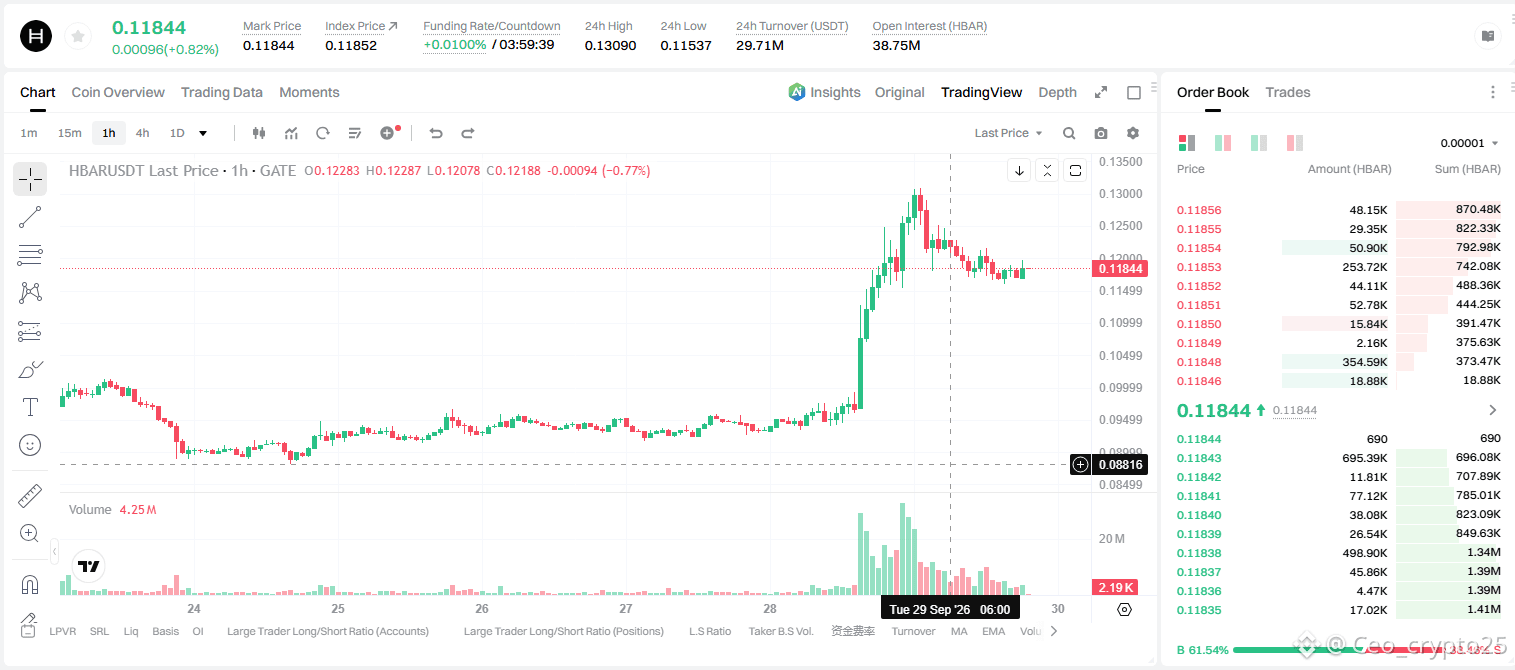
- HBAR spiked hard from ~0.086 to a 0.13 high in a strong impulsive rally, but has since flattened out into a consolidation right below the highs
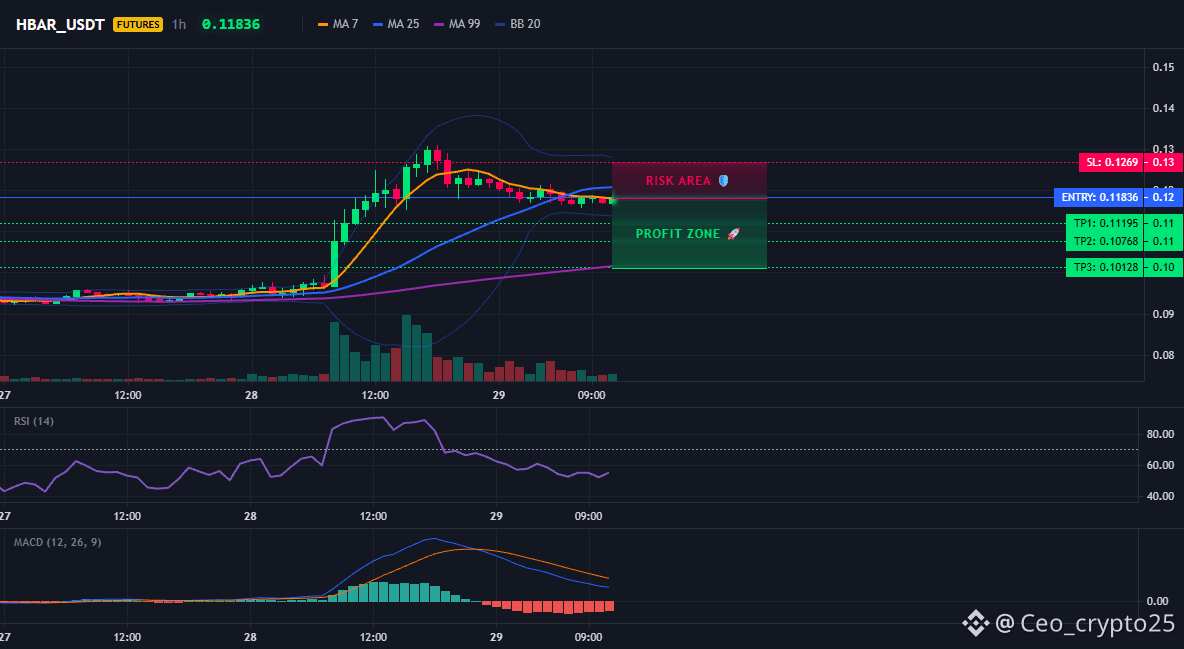
- RSI 14 spiked into the 70s during the rally and has since cooled sharply into the low-50s a clear momentum roll-off after the overbought extreme
- MACD is a key signal here: the histogram peaked and has since turned negative, with the MACD line crossing below its signal line momentum has flipped bearish after the rally exhausted
- Price is consolidating right at the MA7/MA25 cluster (~0.118–0.119), which is now flattening after acting as strong support during the rally a break below would open room for a retracement
- The rising MA99 (purple) sits well below near 0.10, giving room for a healthy pullback without breaking the broader structure
- Stop placed above the recent local high near 0.127, which caps risk if the rally resumes
$HBAR
Pair: $HBAR /USDT
Direction: SHORT
Leverage: 5x
Entry Zone: 0.1180 – 0.1188
Take Profit:
- TP1: 0.11195 +19%
- TP2: 0.10768 +28%
- TP3: 0.10128 +43%
Stop Loss: 0.12690
Chart Structure:
- HBAR spiked hard from ~0.086 to a 0.13 high in a strong impulsive rally, but has since flattened out into a consolidation right below the highs
- RSI 14 spiked into the 70s during the rally and has since cooled sharply into the low-50s a clear momentum roll-off after the overbought extreme
- MACD is a key signal here: the histogram peaked and has since turned negative, with the MACD line crossing below its signal line momentum has flipped bearish after the rally exhausted
- Price is consolidating right at the MA7/MA25 cluster (~0.118–0.119), which is now flattening after acting as strong support during the rally a break below would open room for a retracement
- The rising MA99 (purple) sits well below near 0.10, giving room for a healthy pullback without breaking the broader structure
- Stop placed above the recent local high near 0.127, which caps risk if the rally resumes
$HBAR