🧭 ZEC IS BUILDING A SECOND BASE UNDER THE RANGE CEILING
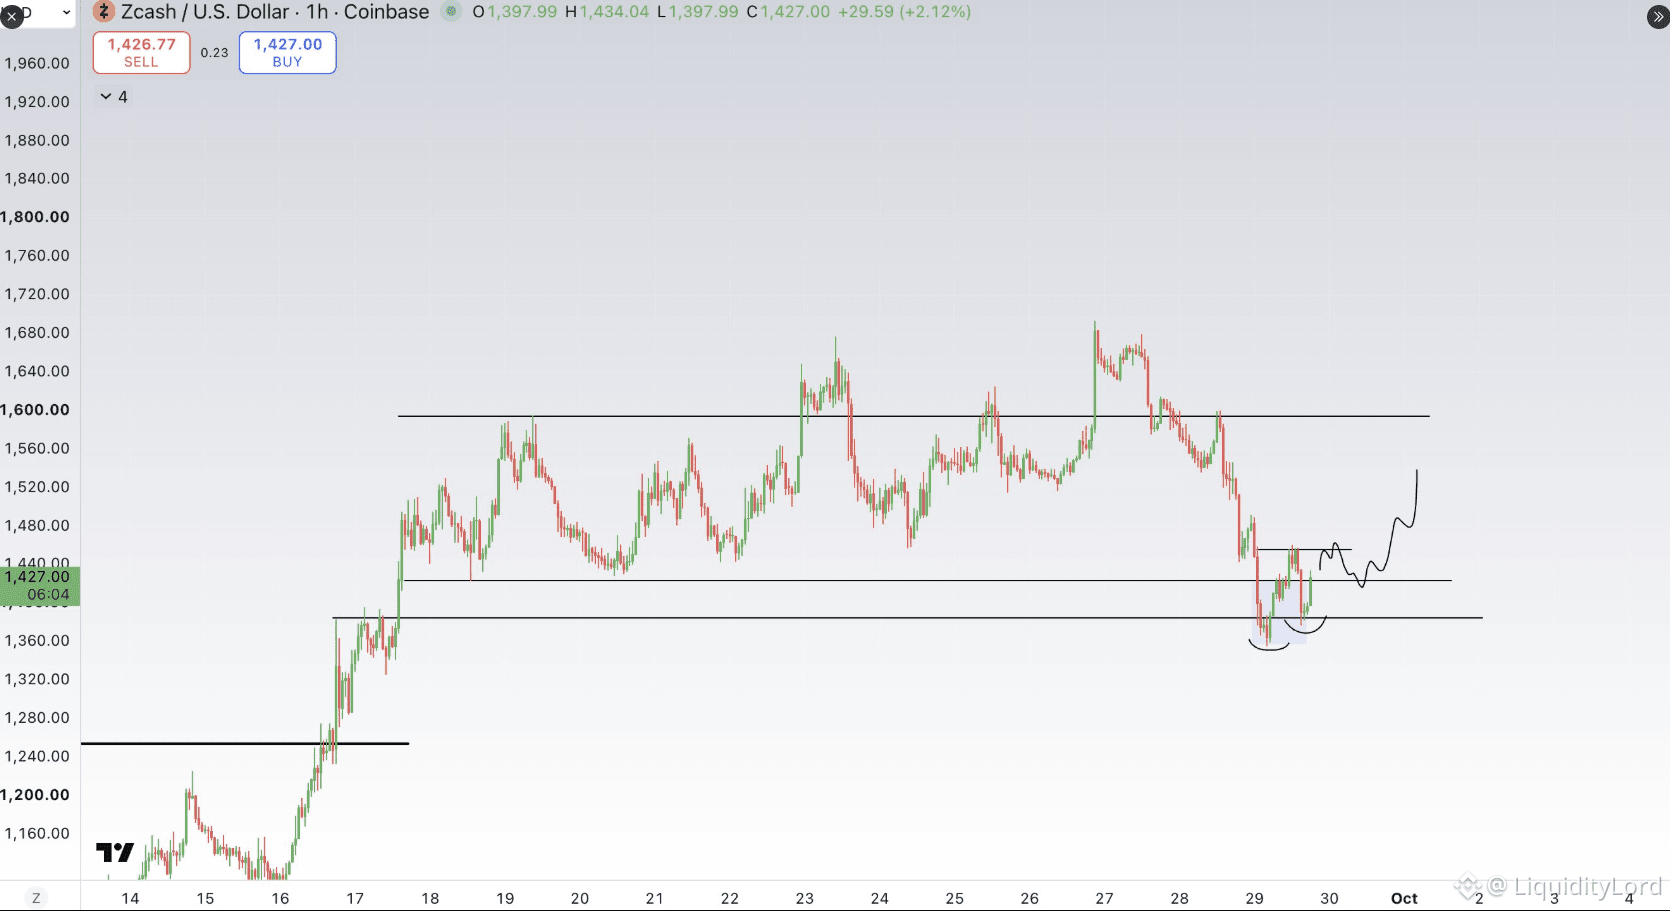
ZEC/USD on the 1H chart is around 1,427 after a steep decline from the 1,680 area. Price flushed toward 1,350–1,380, then stabilized and started recovering. The important feature now is the attempt to form a higher low above the latest reaction bottom.
📐 THE RANGE HAS A CLEAR MAP
The chart has repeatedly reacted between the lower 1,370–1,420 region and resistance near 1,590–1,600. Earlier pushes into the upper boundary were rejected, while the latest selloff found buyers near the lower boundary.
1,370–1,390 → major support
1,420–1,440 → current pivot
1,480–1,500 → first recovery zone
1,550–1,600 → major resistance
1,640–1,680 → upper supply
🔎 THE SECOND-LOW TEST
Price is recovering from the sharp rejection near 1,350 and returning toward 1,430. A sustained hold above 1,420 would keep the short-term recovery structure intact. Now the key is whether buyers can turn this area into support rather than produce another bounce inside the range.
🎯 THE PRICE ROADMAP
A cleaner long setup appears around 1,420–1,440 after a confirmed hold or retest. Invalidation sits below 1,370 on sustained acceptance.
TP1 → 1,500
TP2 → 1,590
TP3 → 1,680
The first objective sits inside the range, making it an important reaction point, while 1,590–1,600 remains the major decision zone. A convincing break above that ceiling would expose the higher 1,640–1,680 area.
⚙ EXECUTION HAS ANOTHER DIMENSION
Ominstion can be viewed as a separate DeFi execution layer, where routing and cross-chain movement matter when liquidity is fragmented across networks. That utility is independent of ZEC and should not confirm these technical levels.
For ZEC, the immediate test is 1,420–1,440. Hold it and the recovery can challenge the middle and upper parts of the range. Lose 1,370, and the base-building idea loses its structure.
NFA - DYOR
$ZEC
ZEC/USD on the 1H chart is around 1,427 after a steep decline from the 1,680 area. Price flushed toward 1,350–1,380, then stabilized and started recovering. The important feature now is the attempt to form a higher low above the latest reaction bottom.
📐 THE RANGE HAS A CLEAR MAP
The chart has repeatedly reacted between the lower 1,370–1,420 region and resistance near 1,590–1,600. Earlier pushes into the upper boundary were rejected, while the latest selloff found buyers near the lower boundary.
1,370–1,390 → major support
1,420–1,440 → current pivot
1,480–1,500 → first recovery zone
1,550–1,600 → major resistance
1,640–1,680 → upper supply
🔎 THE SECOND-LOW TEST
Price is recovering from the sharp rejection near 1,350 and returning toward 1,430. A sustained hold above 1,420 would keep the short-term recovery structure intact. Now the key is whether buyers can turn this area into support rather than produce another bounce inside the range.
🎯 THE PRICE ROADMAP
A cleaner long setup appears around 1,420–1,440 after a confirmed hold or retest. Invalidation sits below 1,370 on sustained acceptance.
TP1 → 1,500
TP2 → 1,590
TP3 → 1,680
The first objective sits inside the range, making it an important reaction point, while 1,590–1,600 remains the major decision zone. A convincing break above that ceiling would expose the higher 1,640–1,680 area.
⚙ EXECUTION HAS ANOTHER DIMENSION
Ominstion can be viewed as a separate DeFi execution layer, where routing and cross-chain movement matter when liquidity is fragmented across networks. That utility is independent of ZEC and should not confirm these technical levels.
For ZEC, the immediate test is 1,420–1,440. Hold it and the recovery can challenge the middle and upper parts of the range. Lose 1,370, and the base-building idea loses its structure.
NFA - DYOR
$ZEC