Litecoin (LTC) Market Analysis — Pullback After $75
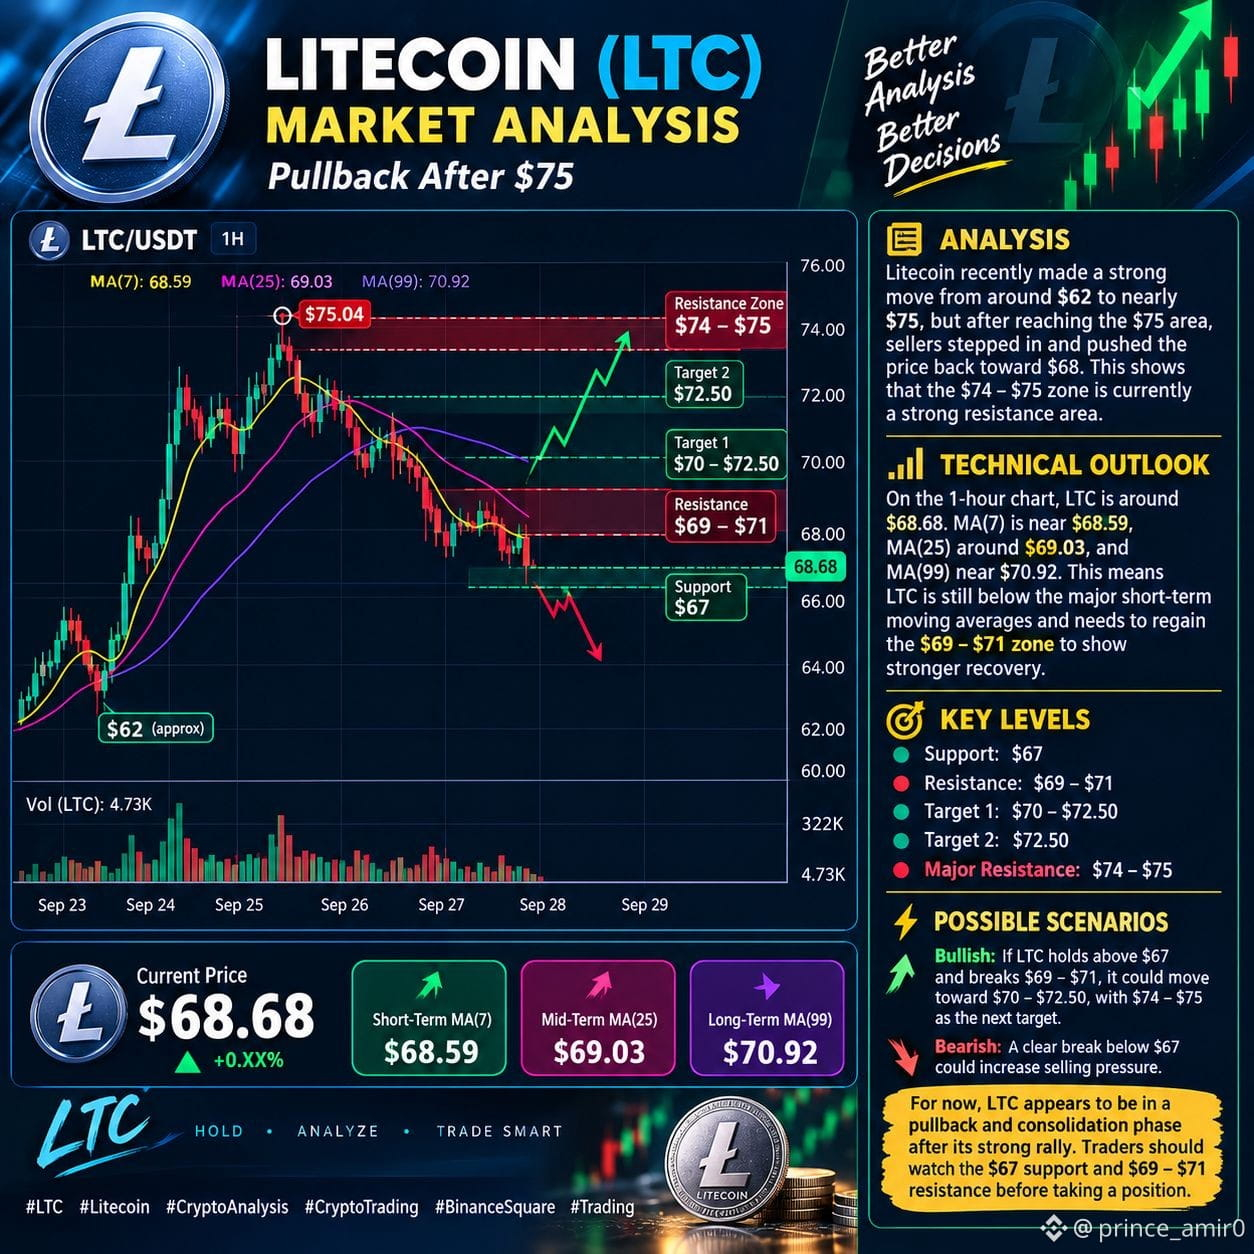
Litecoin recently made a strong move from around $62 to nearly $75, but after reaching the $75 area, sellers stepped in and pushed the price back toward $68. This shows that the $74–$75 zone is currently a strong resistance area.
On the 1-hour chart, LTC is around $68.68. MA(7) is near $68.59, MA(25) around $69.03, and MA(99) near $70.92. This means LTC is still below the major short-term moving averages and needs to regain the $69–$71 zone to show stronger recovery.
The key support is around $67. If LTC holds this level and buyers return, the price could attempt to move toward $70–$72.50, with $74–$75 as the major resistance zone. However, a clear break below $67 could increase selling pressure.
For now, LTC appears to be in a pullback and consolidation phase after its strong rally. Traders should watch the $67 support and $69–$71 resistance before taking a position.
#LTC📈 #Litecoin #CryptoAnalysis #cryptotrading #BinanceSquare $LTC
Litecoin recently made a strong move from around $62 to nearly $75, but after reaching the $75 area, sellers stepped in and pushed the price back toward $68. This shows that the $74–$75 zone is currently a strong resistance area.
On the 1-hour chart, LTC is around $68.68. MA(7) is near $68.59, MA(25) around $69.03, and MA(99) near $70.92. This means LTC is still below the major short-term moving averages and needs to regain the $69–$71 zone to show stronger recovery.
The key support is around $67. If LTC holds this level and buyers return, the price could attempt to move toward $70–$72.50, with $74–$75 as the major resistance zone. However, a clear break below $67 could increase selling pressure.
For now, LTC appears to be in a pullback and consolidation phase after its strong rally. Traders should watch the $67 support and $69–$71 resistance before taking a position.
#LTC📈 #Litecoin #CryptoAnalysis #cryptotrading #BinanceSquare $LTC