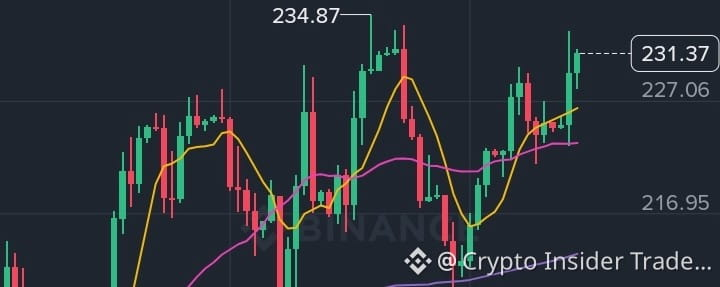

Nvidia is back in the spotlight.
A massive buyback announcement has arrived just as chip stocks navigate a volatile environment, and NVDA is now pushing toward a critical resistance zone. The question traders are asking:
Is this the start of a fresh breakout, or another fake-out before a pullback?
◆━━━━━━━━━━━━━━━━━━◆
✔︎ MARKET SNAPSHOT
◆━━━━━━━━━━━━━━━━━━◆
✔︎ Price: $230.60 (+3.38%)
✔︎ Day Range: $227.91 – $232.35
✔︎ Market Cap: ~$5.44T
✔︎ Recent Swing High: $234.76
✔︎ Recent Swing Low: $188.81
After rebounding more than 22% from its recent low, NVDA is now testing the upper boundary of its trading range, placing it at a key decision point for both bulls and bears.
◆━━━━━━━━━━━━━━━━━━◆
➤ THE BIG CATALYST
◆━━━━━━━━━━━━━━━━━━◆
Nvidia's board approved an additional $150 billion share repurchase program, increasing total authorization to $235 billion through fiscal 2028.
Why does this matter?
① Buybacks reduce the number of shares in circulation.
② They often signal management confidence in the company's future.
③ They can strengthen investor sentiment during uncertain market conditions.
While headlines can create short-term excitement, sustained moves still require confirmation from price action and volume.
◆━━━━━━━━━━━━━━━━━━◆
➤ TECHNICAL ANALYSIS (Daily Chart)
◆━━━━━━━━━━━━━━━━━━◆
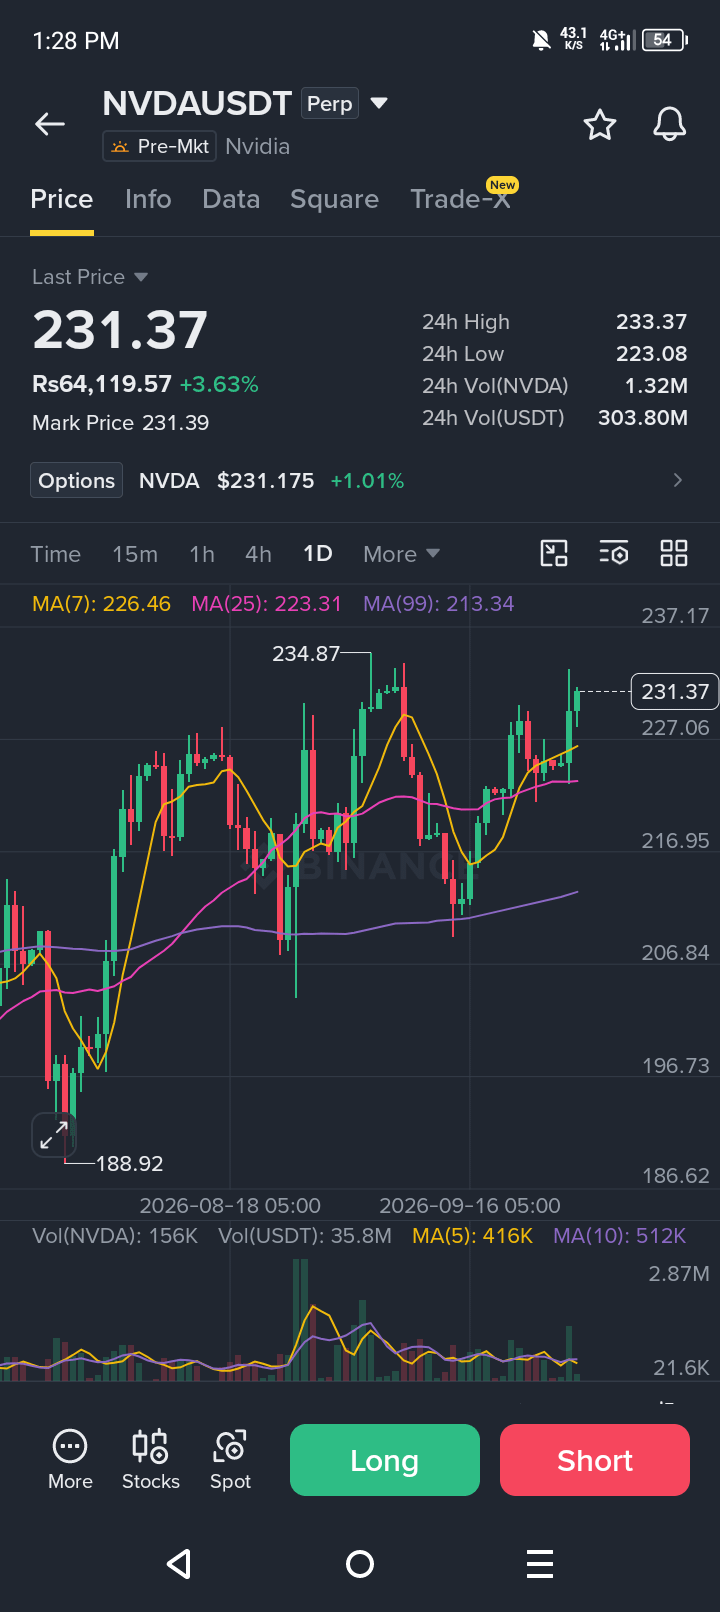
① Moving Average Structure
✔︎ MA5: 226.94
✔︎ MA10: 225.63
✔︎ MA20: 221.60
Price remains above all major short-term averages, and the moving averages are stacked in a healthy bullish sequence.
━━━━━━━━━━━━━━
② Volume Analysis
✔︎ Current Volume: 72.86M
✔︎ MA5 Volume: 48.21M
✔︎ MA10 Volume: 59.05M
The recent advance is supported by stronger participation. Moves backed by rising volume generally carry more significance than rallies on weak activity.
━━━━━━━━━━━━━━
③ Market Structure
After a sharp correction, NVDA established a series of higher lows and is now approaching the previous swing high near $234.76.
That level could determine the next major move.
◆━━━━━━━━━━━━━━━━━━◆
➤ KEY LEVELS TO WATCH
◆━━━━━━━━━━━━━━━━━━◆
Resistance Zones
① $232.35 (Day High)
② $234.76 (Major Swing High)
③ $239.88 (Upper Chart Resistance)
━━━━━━━━━━━━━━
Support Zones
① $227.91 (Day Low)
② $225–227 (MA5 / MA10 Area)
③ $221.60 (MA20 Support)
Deeper Support: $214.05
◆━━━━━━━━━━━━━━━━━━◆
➤ SCENARIO ANALYSIS
◆━━━━━━━━━━━━━━━━━━◆
✔︎ Bullish Scenario
A strong daily close above $234.76, supported by elevated volume, would indicate a potential breakout from the current range.
━━━━━━━━━━━━━━
✔︎ Neutral Scenario
Price continues consolidating between $227 and $234, allowing moving averages to catch up while traders wait for fresh direction.
━━━━━━━━━━━━━━
✔︎ Bearish Scenario
A sustained move below the MA10 and MA20 support region would suggest weakening momentum and increase the risk of a deeper retracement.
◆━━━━━━━━━━━━━━━━━━◆
THE PSYCHOLOGY BEHIND THE MOVE
◆━━━━━━━━━━━━━━━━━━◆
Big green candles often create FOMO.
Sharp pullbacks often create panic.
Experienced traders focus less on emotions and more on evidence. They wait for confirmation, define risk before entering a position, and treat news headlines as only one piece of the puzzle.
Discipline often matters more than prediction.
◆━━━━━━━━━━━━━━━━━━◆
➜ BOTTOM LINE
◆━━━━━━━━━━━━━━━━━━◆
NVDA has entered a critical decision zone.
The massive buyback announcement adds a strong fundamental catalyst, while the chart structure remains constructive. However, the market's attention is now fixed on the $234.76 resistance level.
Whether this becomes a genuine breakout or a failed attempt will likely depend on one thing:
Price action and volume confirmation.
What's your view — breakout or fake-out?
Share this with a trader following US stocks.
Follow for more clear, educational market breakdowns.